Genetic Trends in the National Herd
2 min read
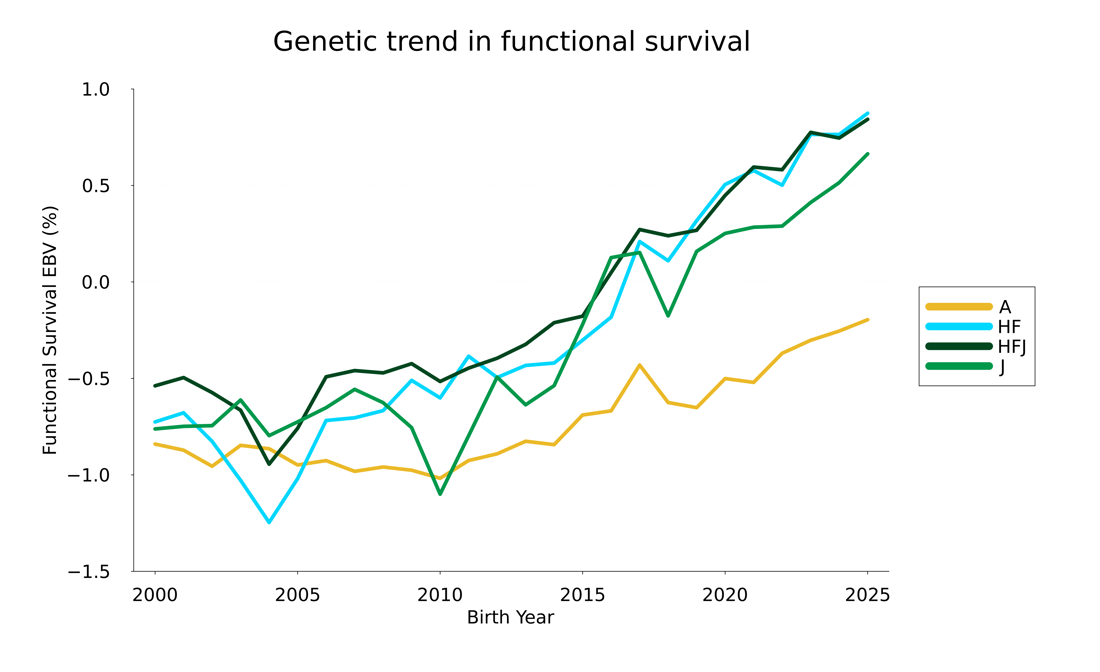
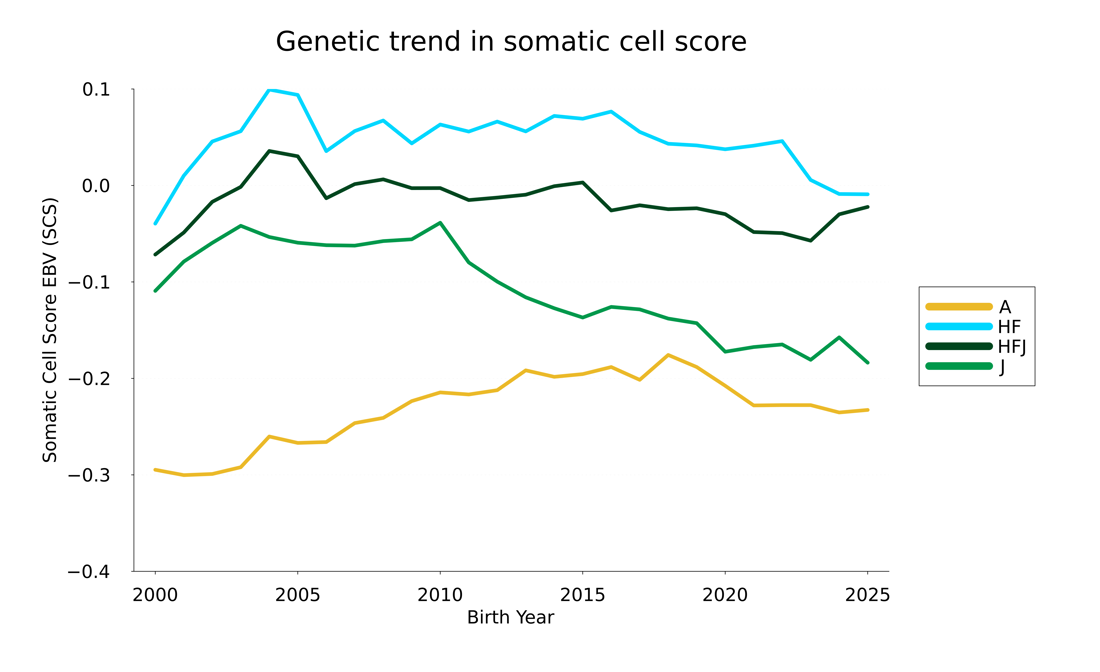
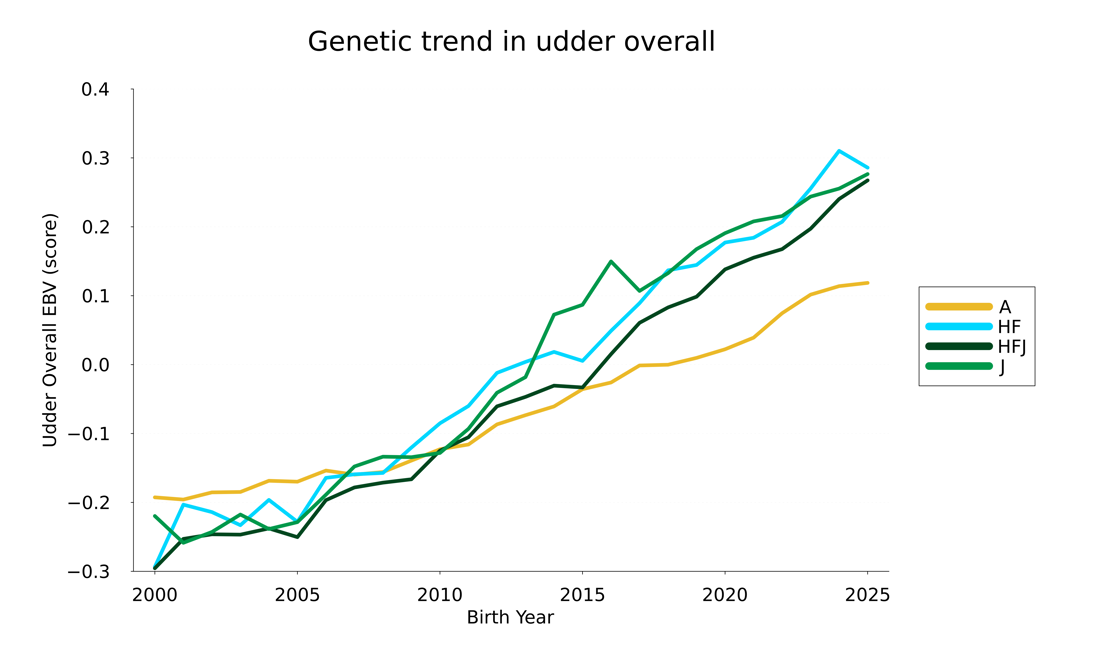
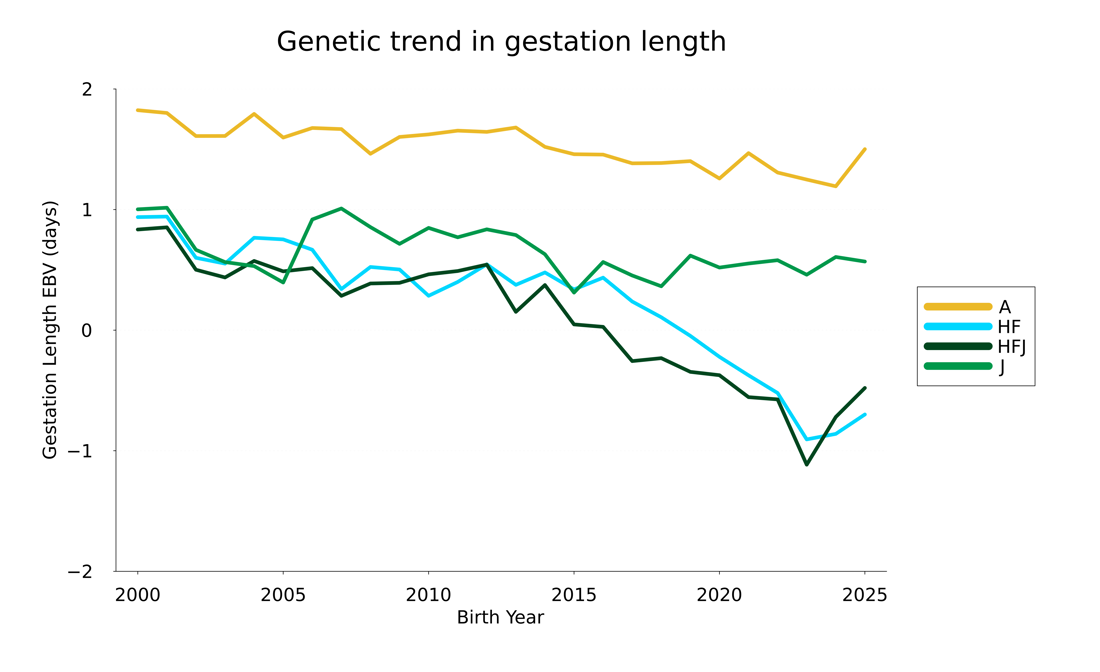
This page tracks genetic trends in the national herd, noting improvements in economically important traits. The genetic merit of the national herd has improved or held steady across a range of economically important traits. The traits covered are Breeding Worth, Production Efficiency, Robustness traits, Farmer Opinion traits, Conformation traits and Additional traits. Breeding Worth (BW) and Production Worth (PW) are valuable tools you can use to make sound decisions about breeding, culling, and buying. BW reflects a cow's potential to breed profitable offspring, while PW focuses on a cow's lifelong profit-making ability.
The genetic merit of the national herd has improved or held steady across a range of economically important traits. These trends reflect the success of targeted breeding programs, better use of genetic evaluation tools, and farmer adoption of high-merit sires. The overall trajectory supports a more profitable and sustainable dairy industry in New Zealand.
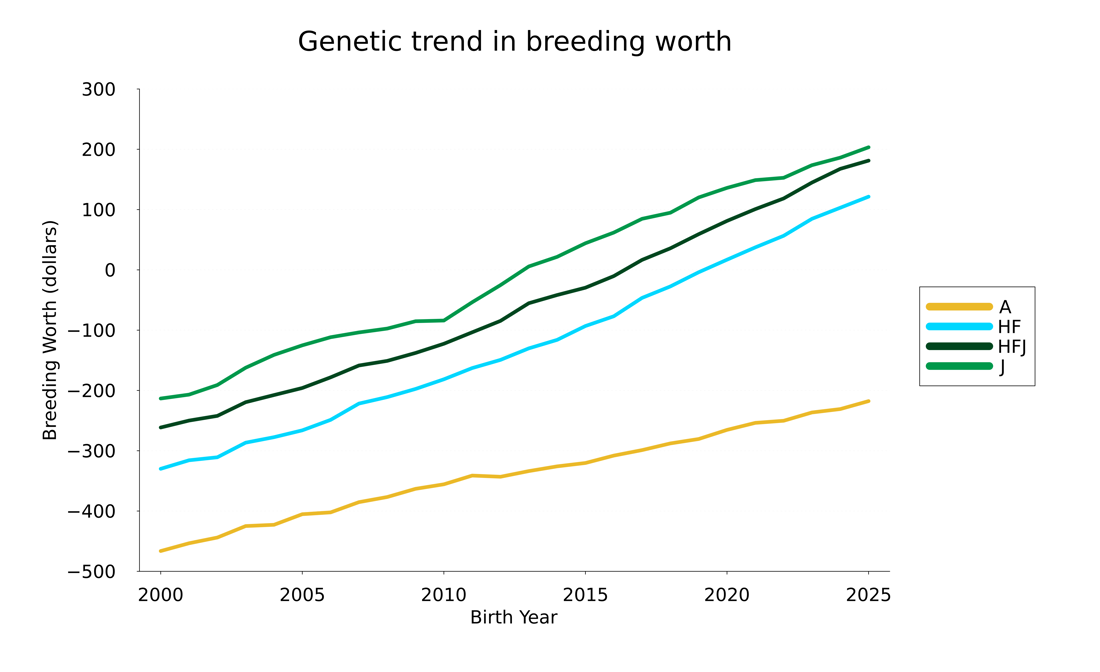
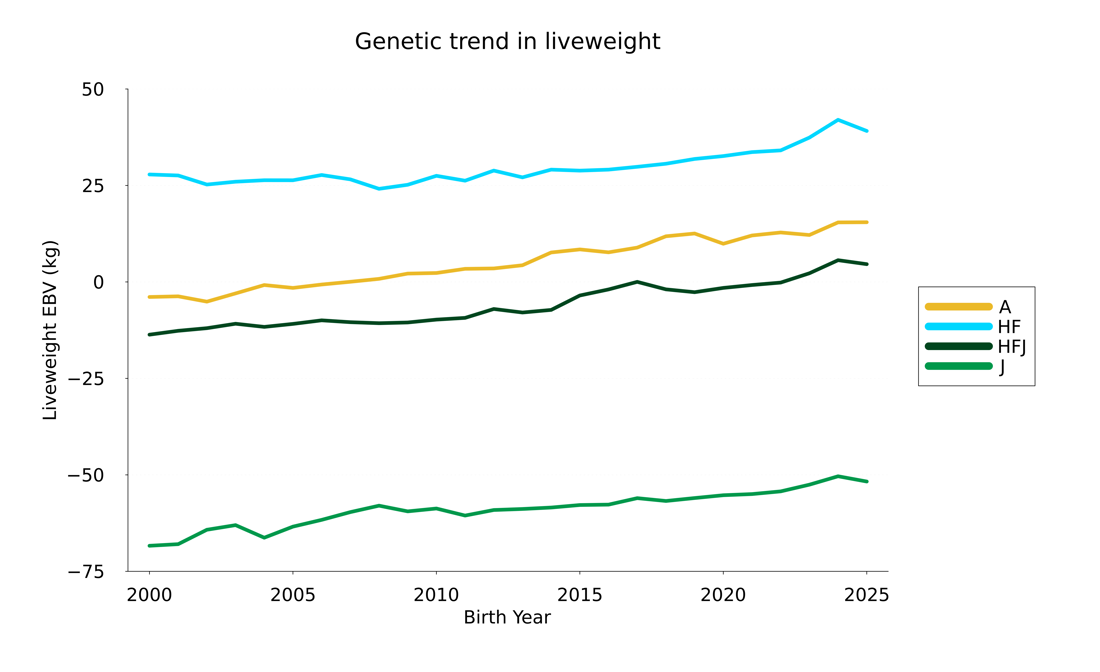
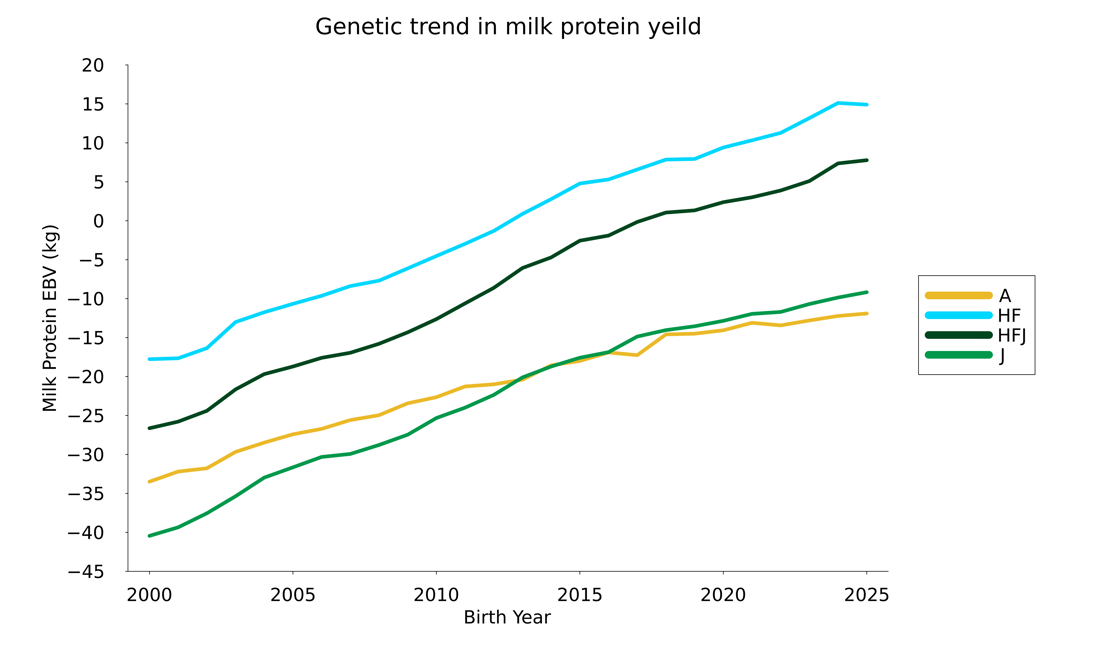
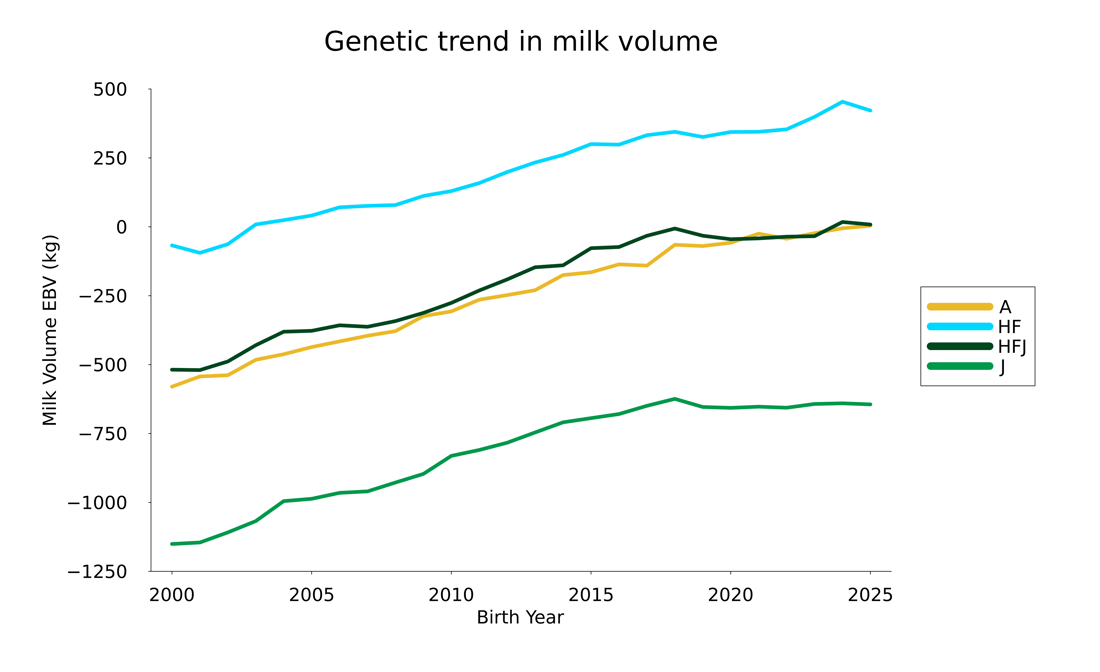
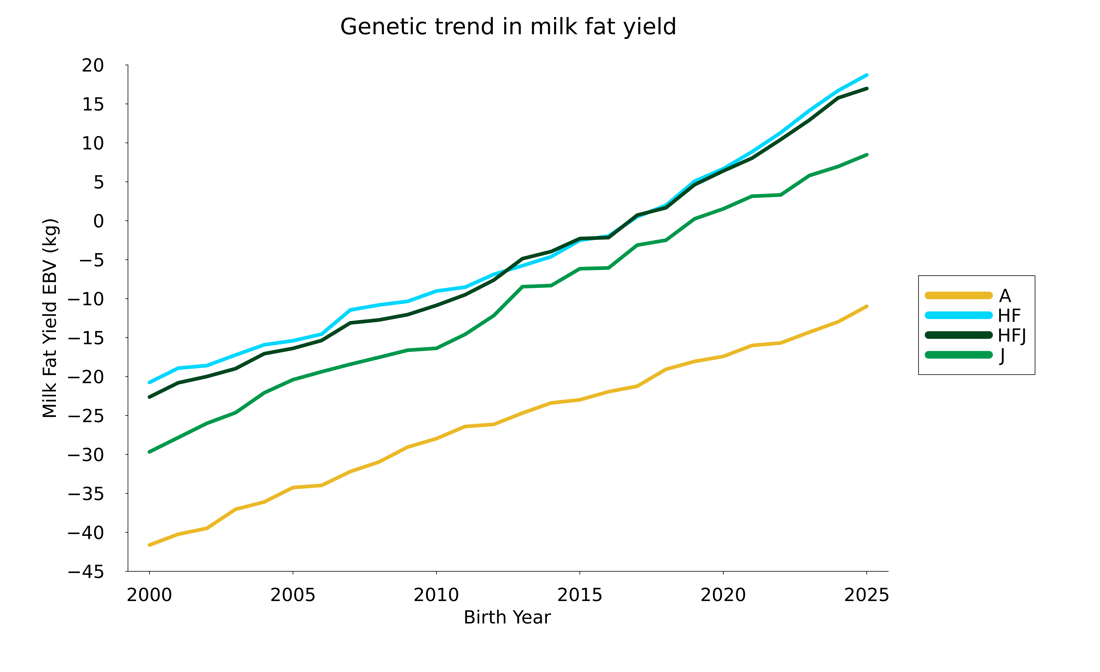
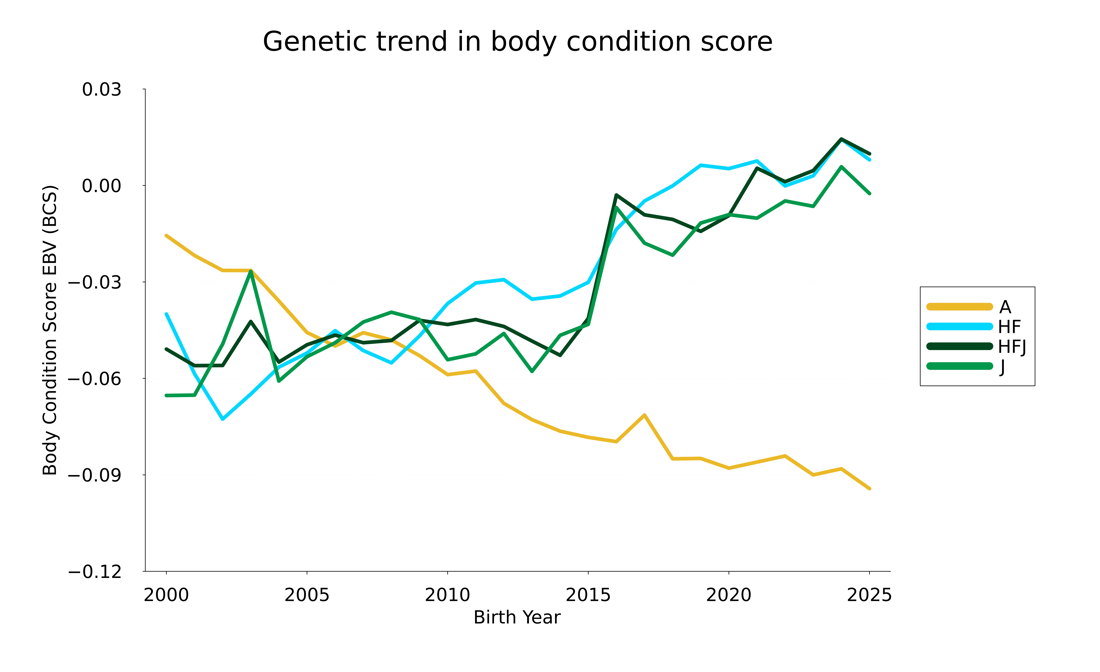
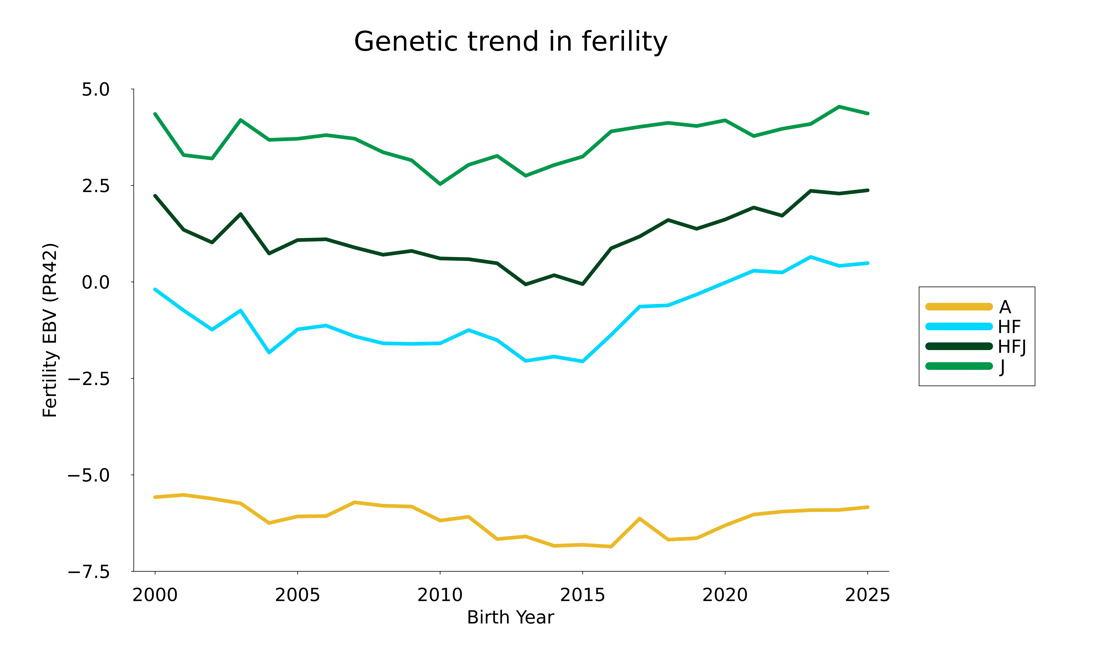
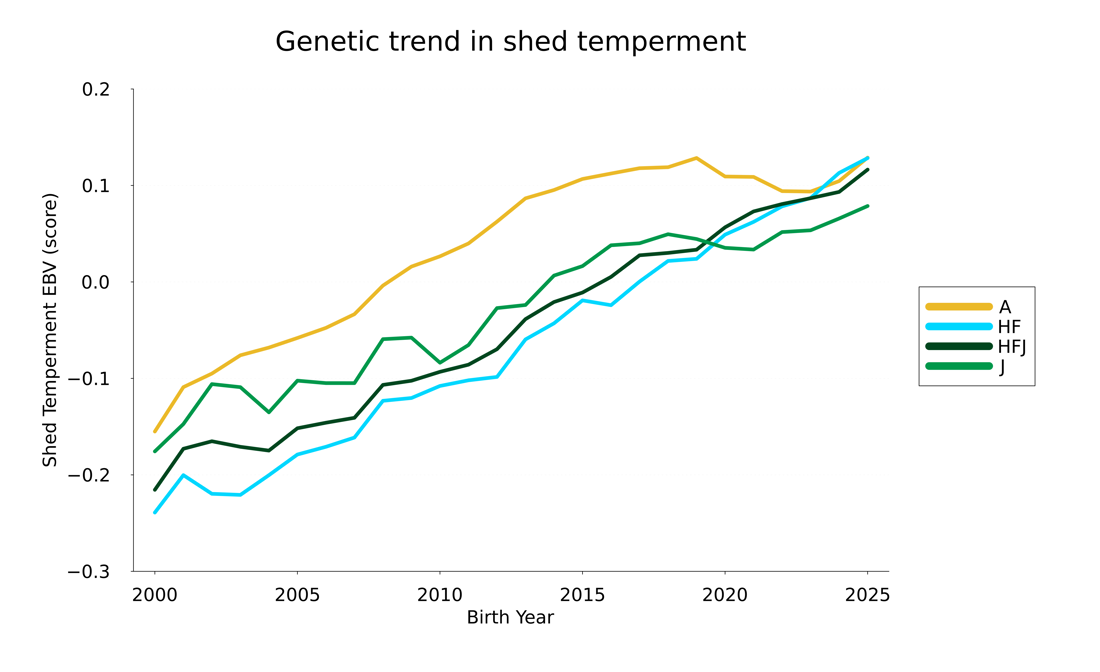
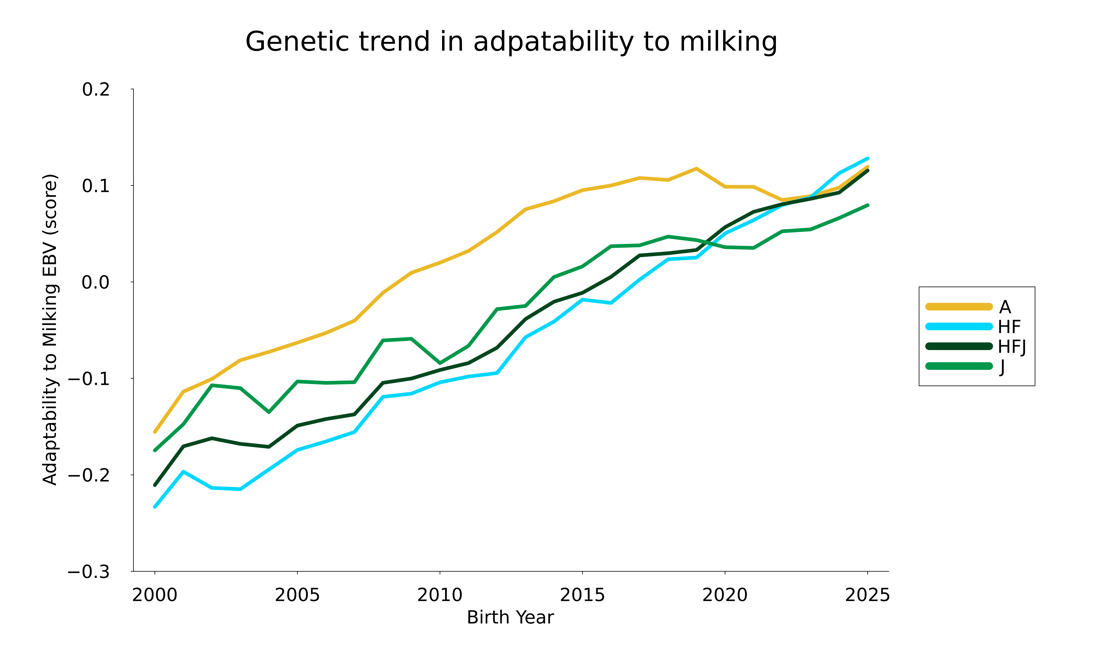
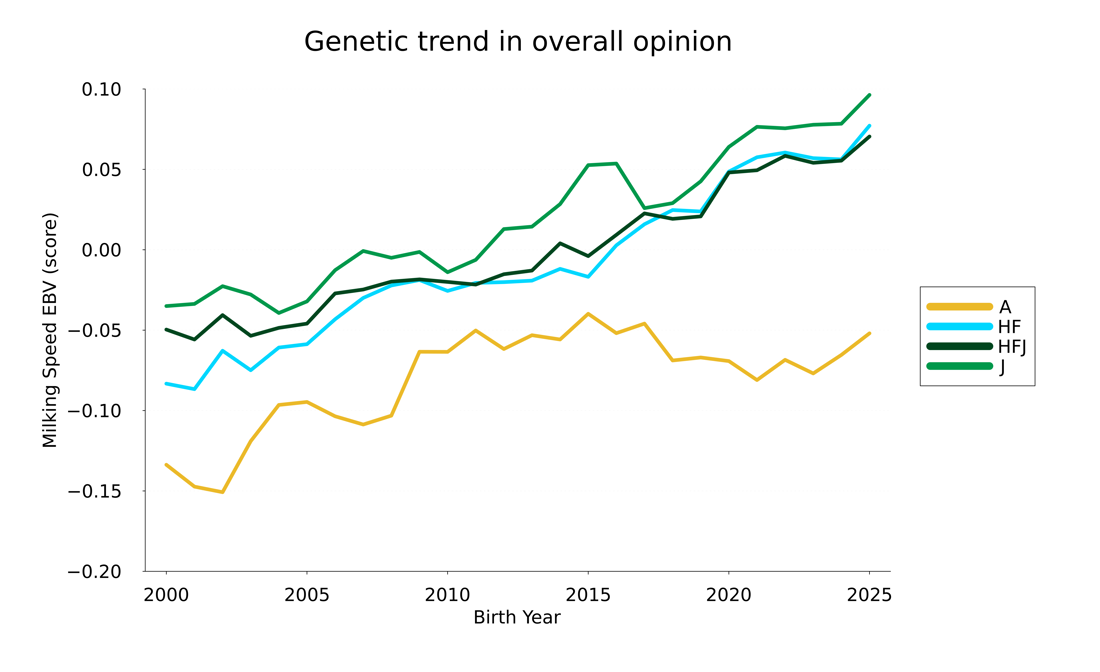
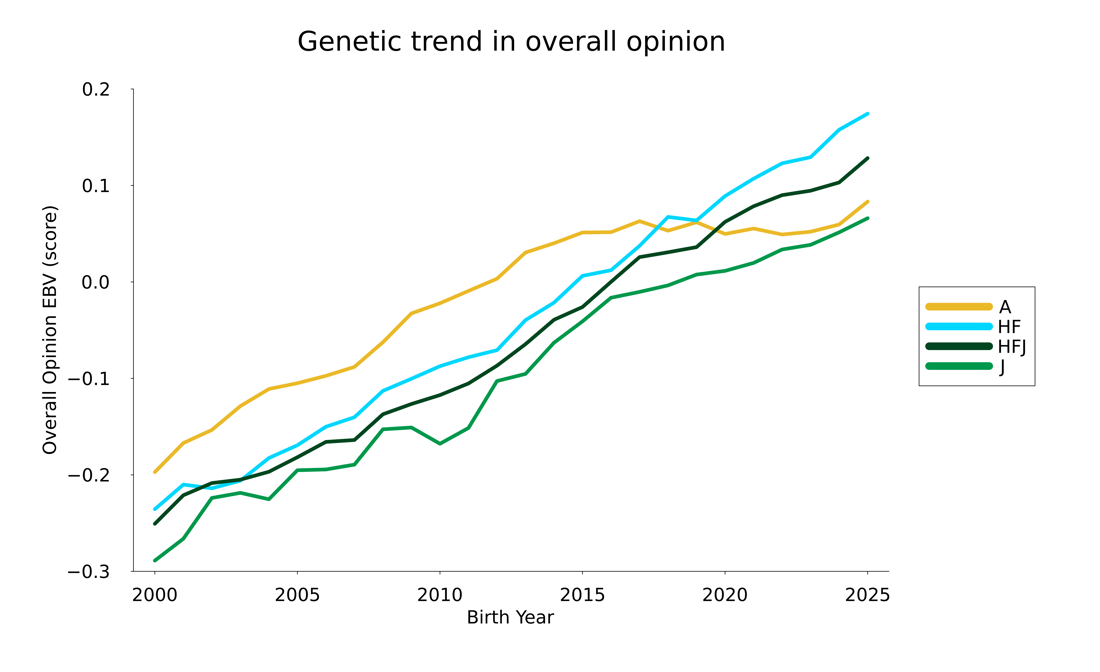
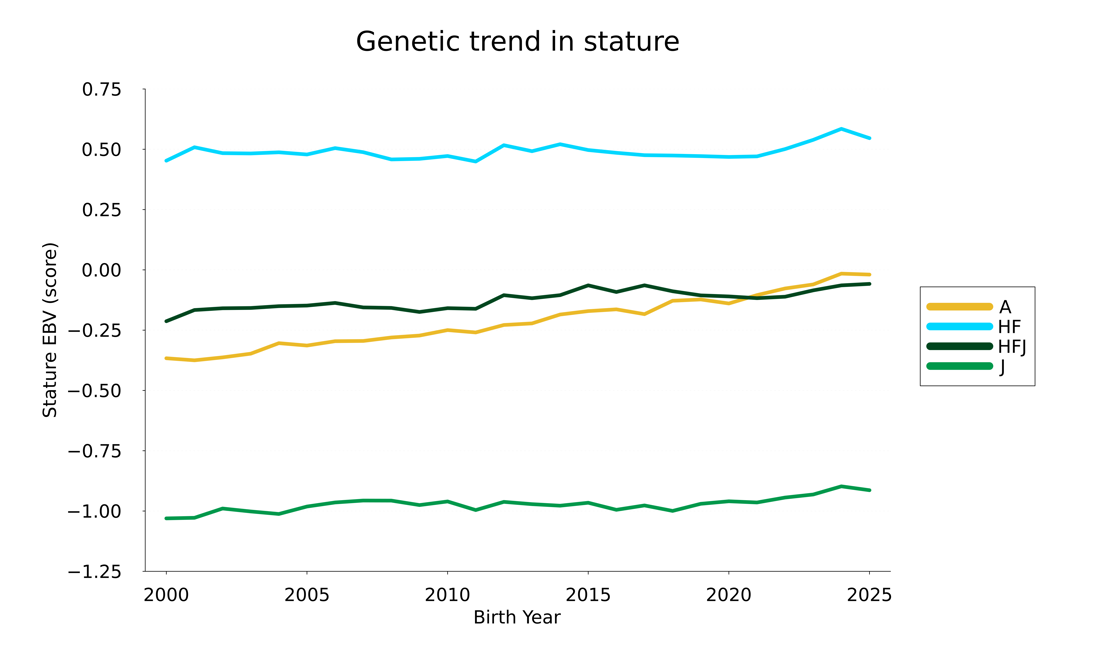
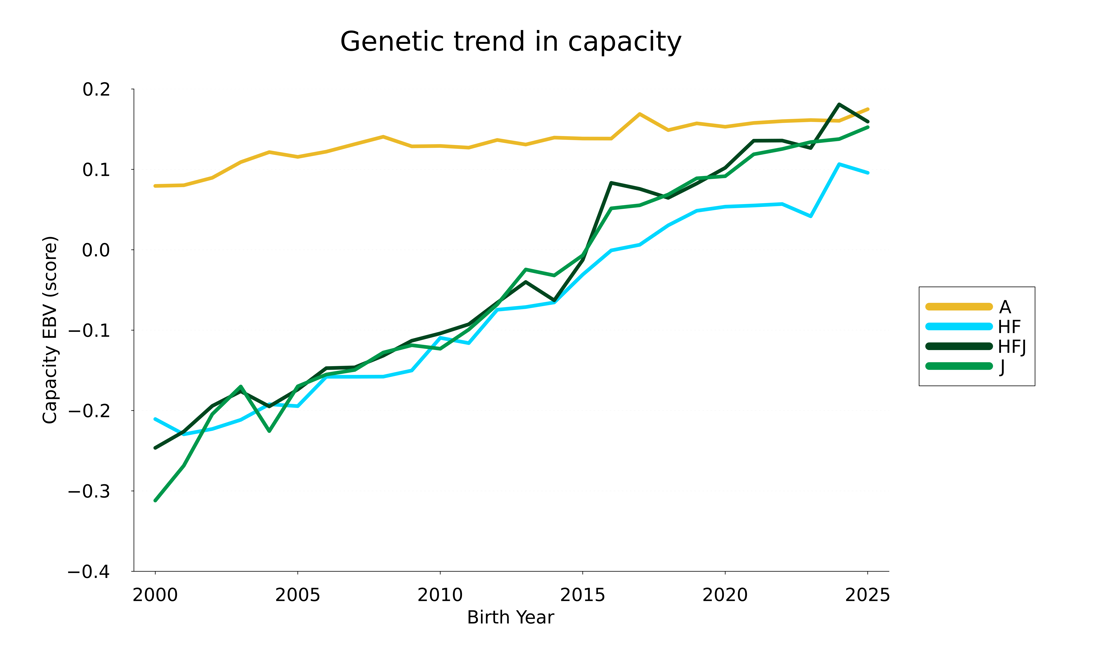
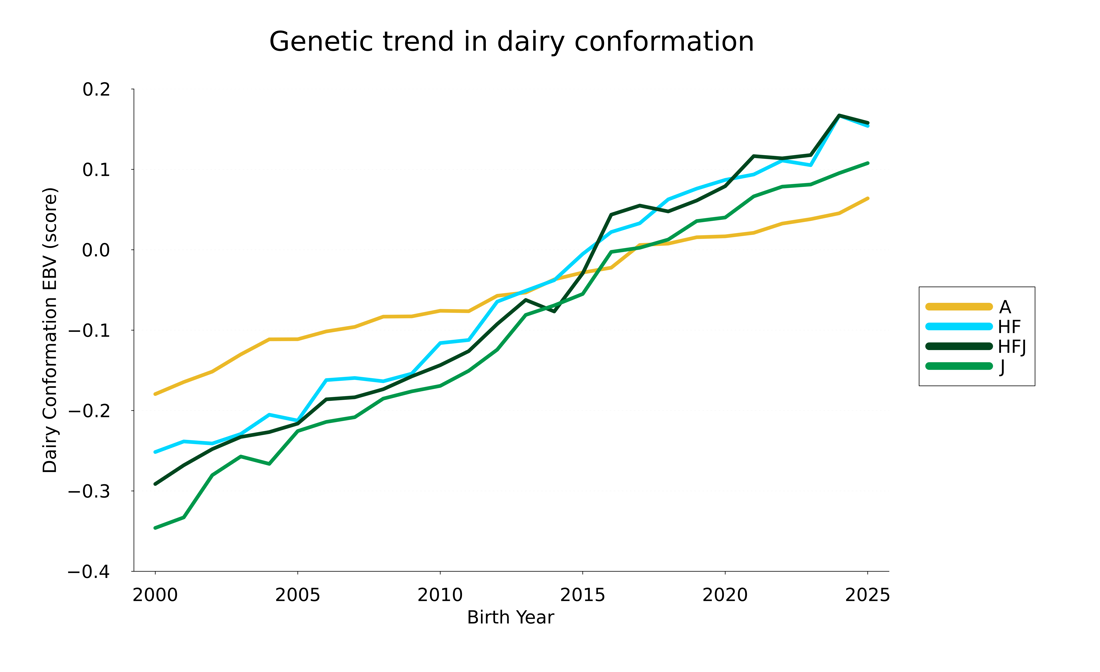
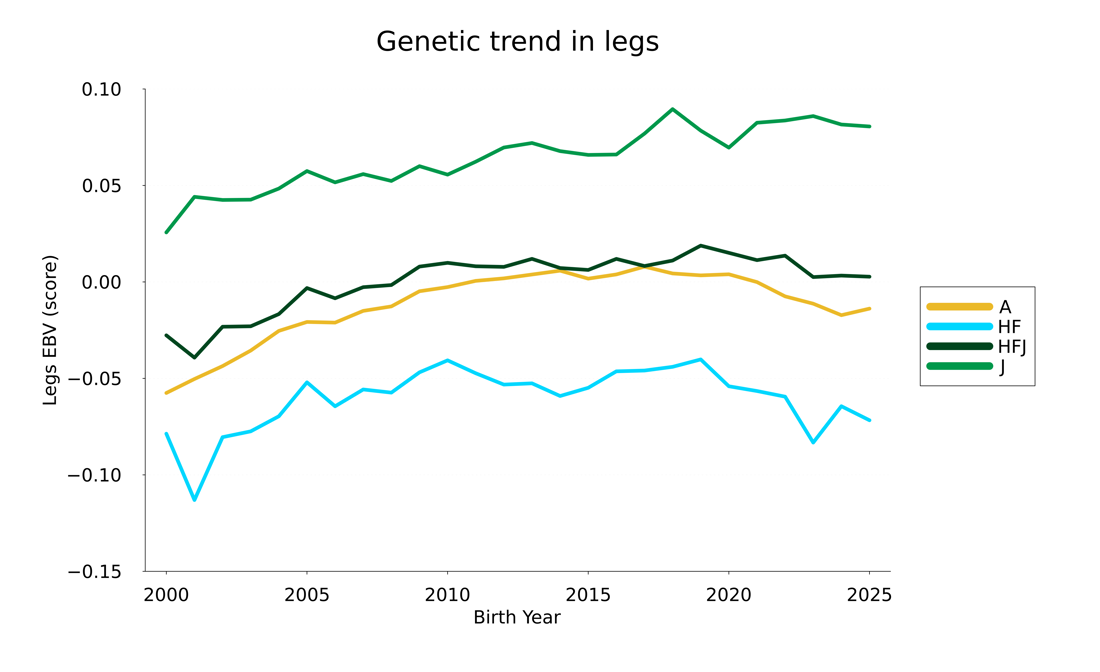
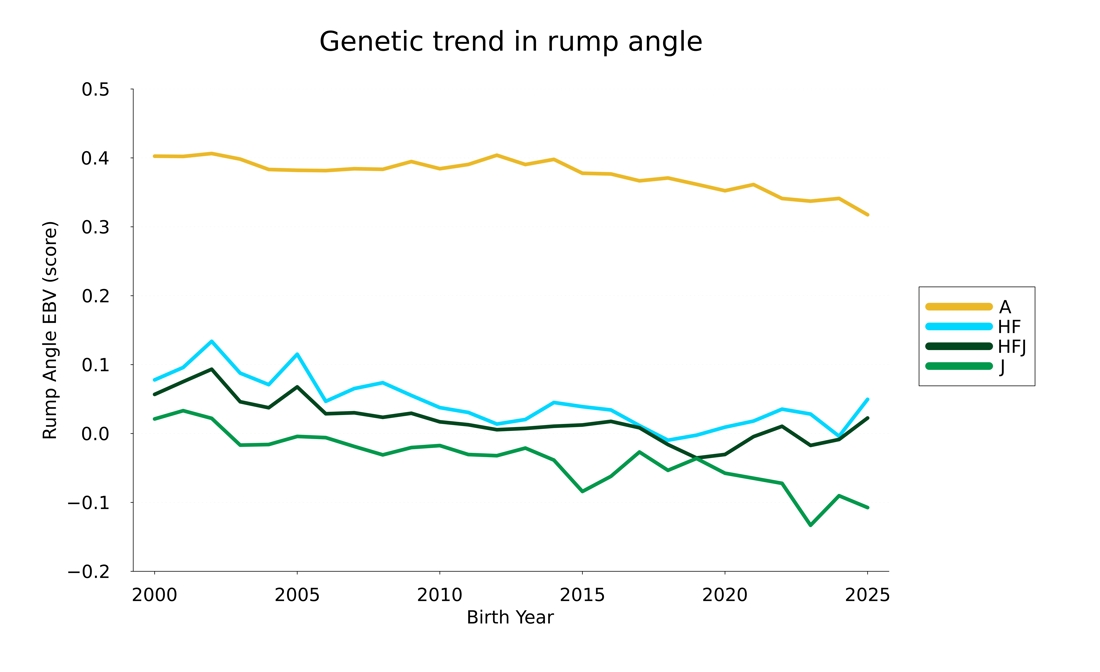
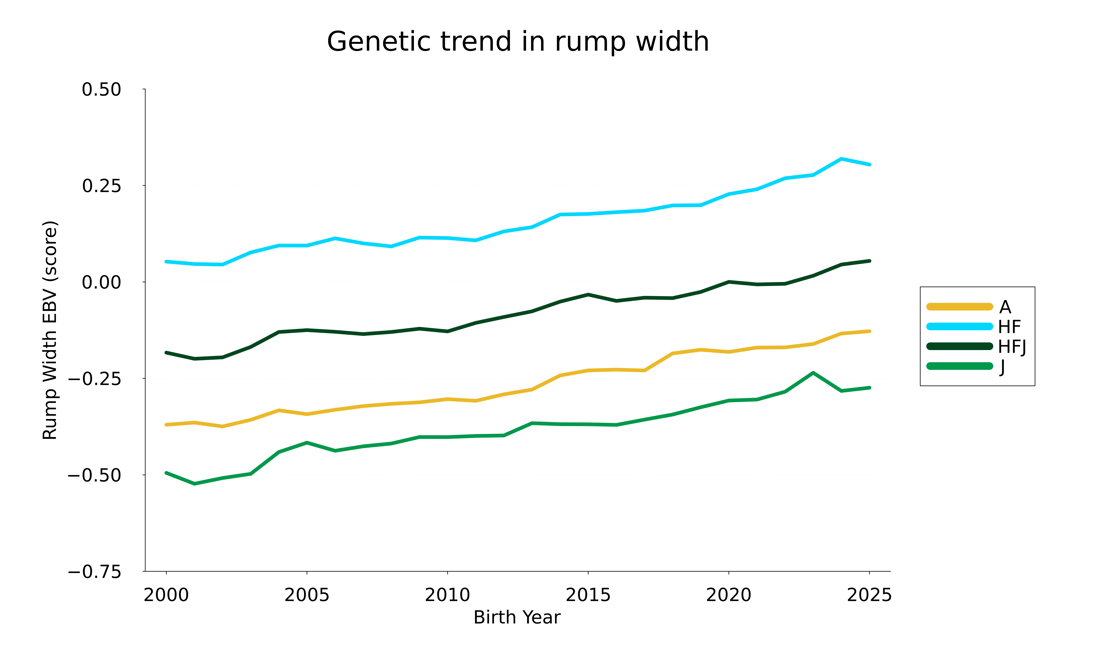
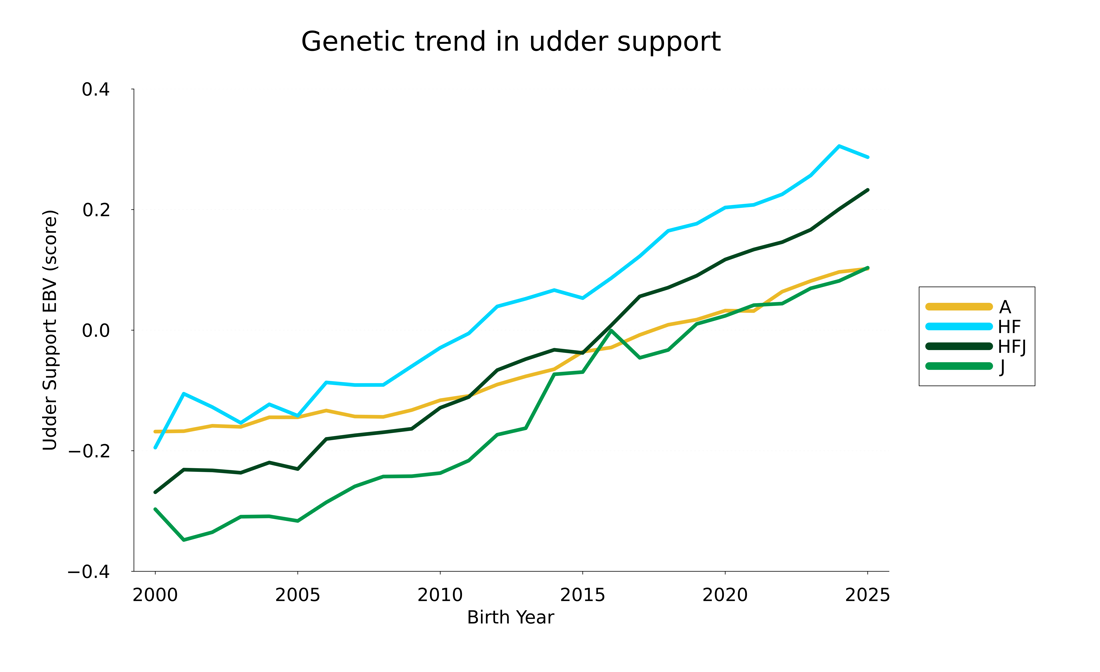
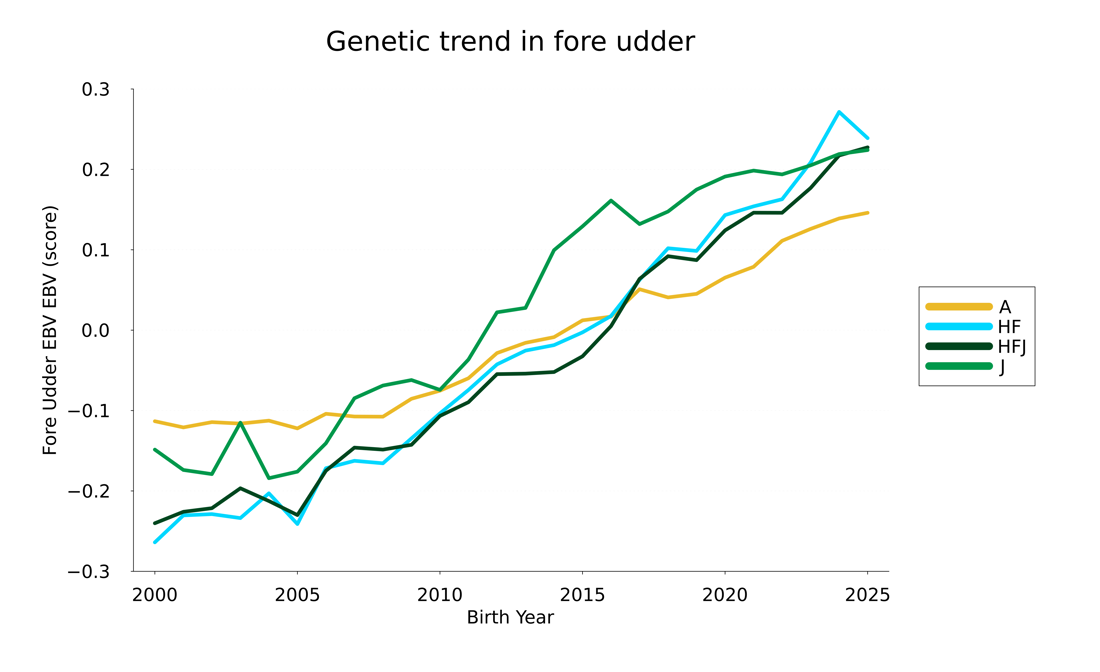
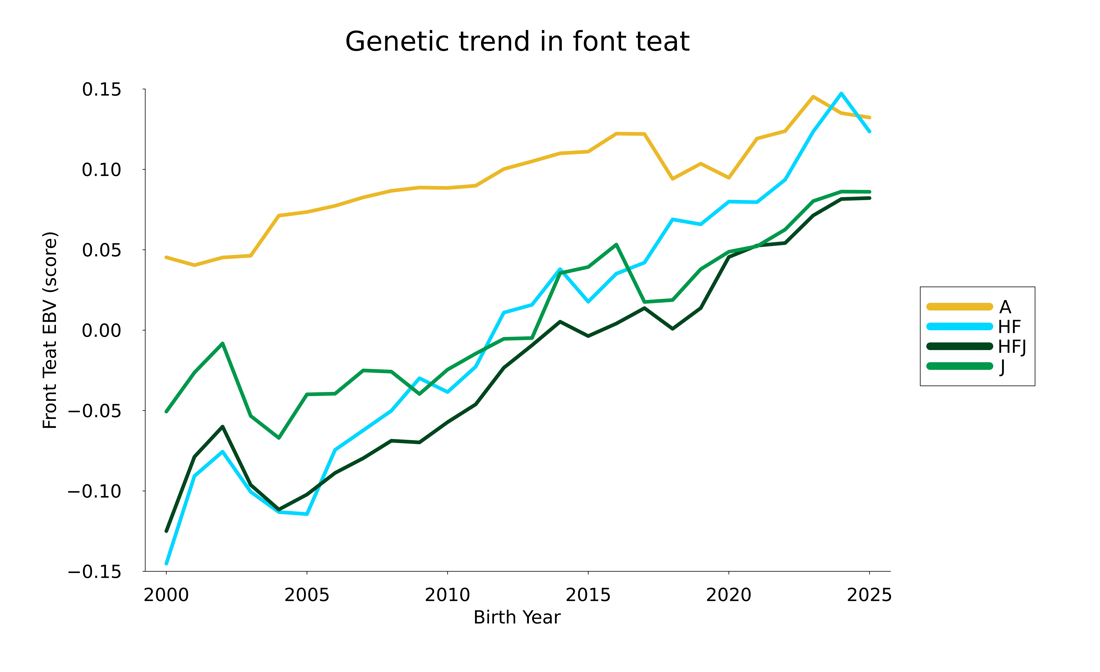
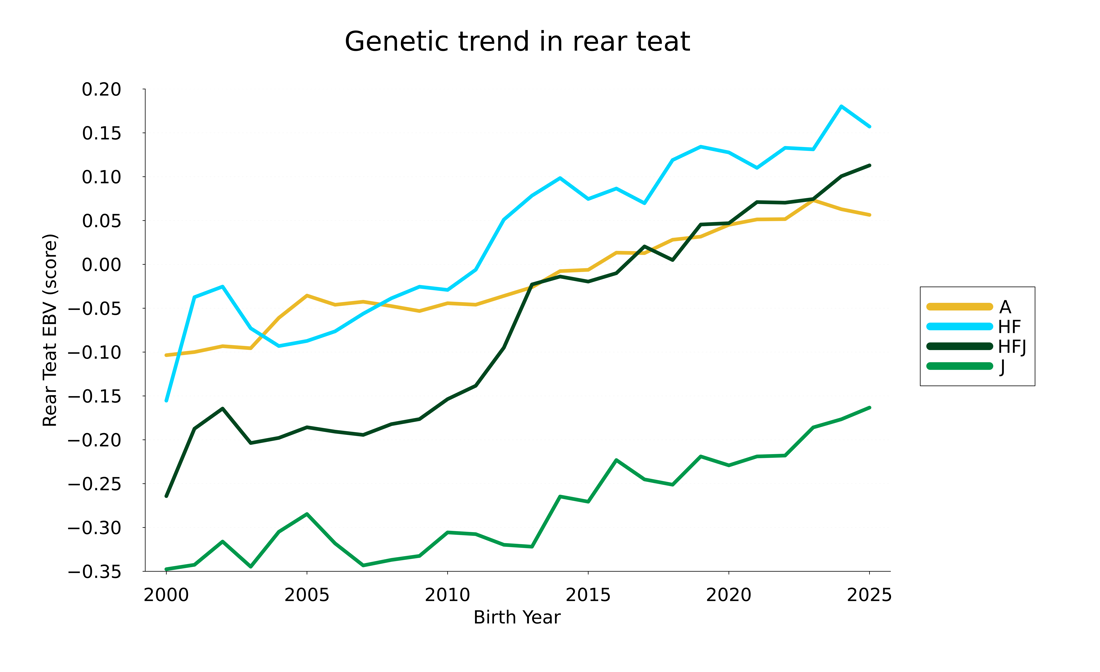
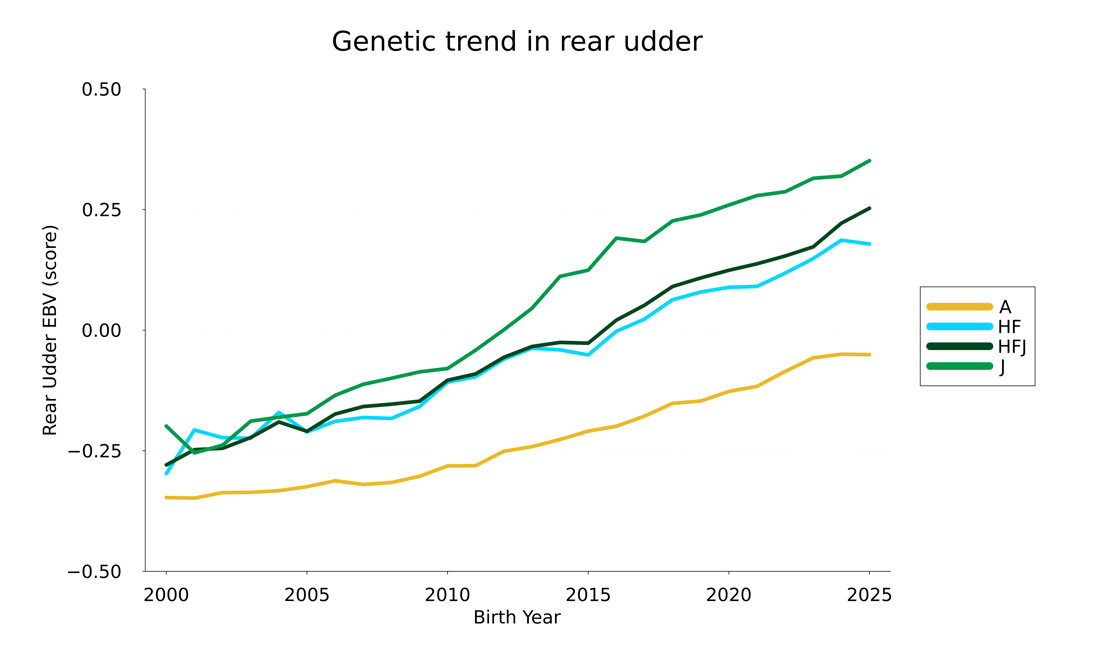
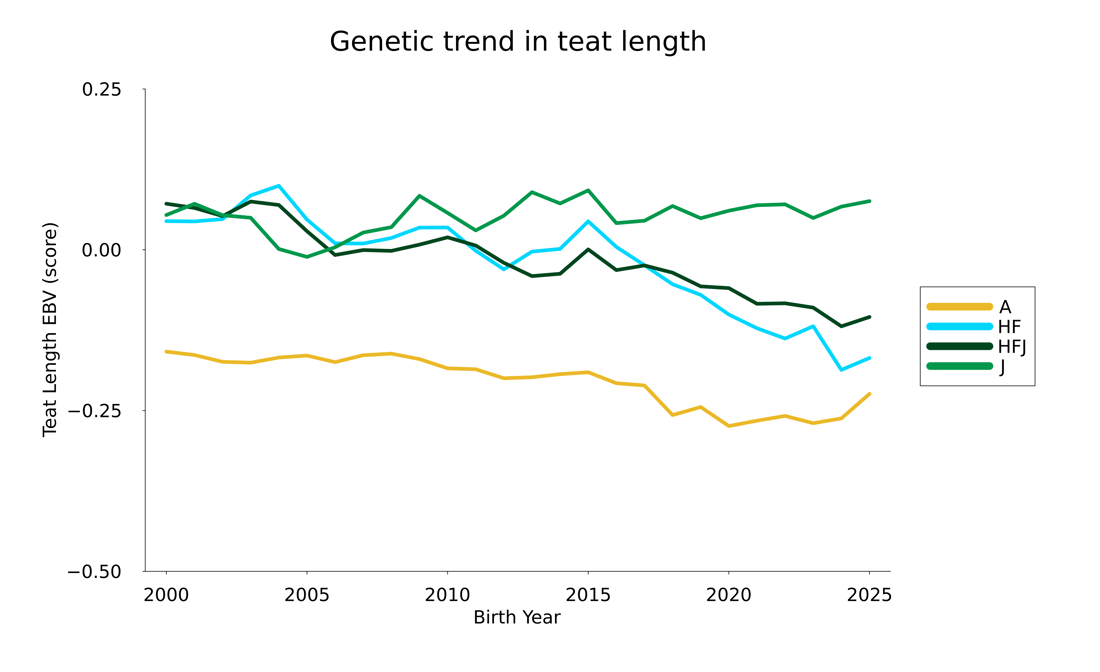
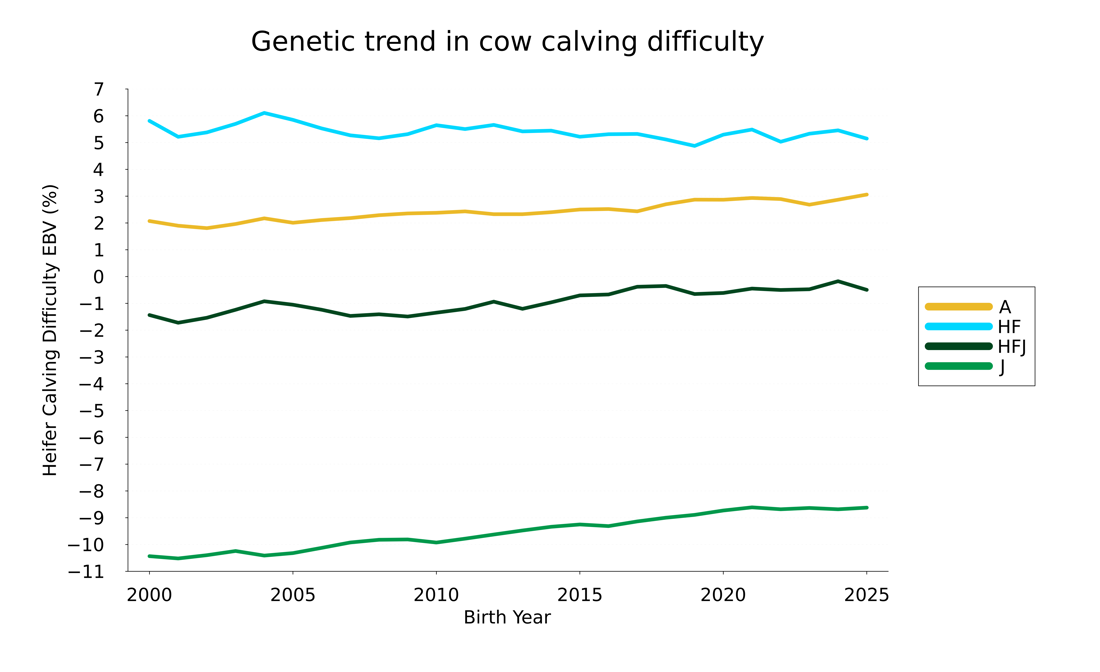
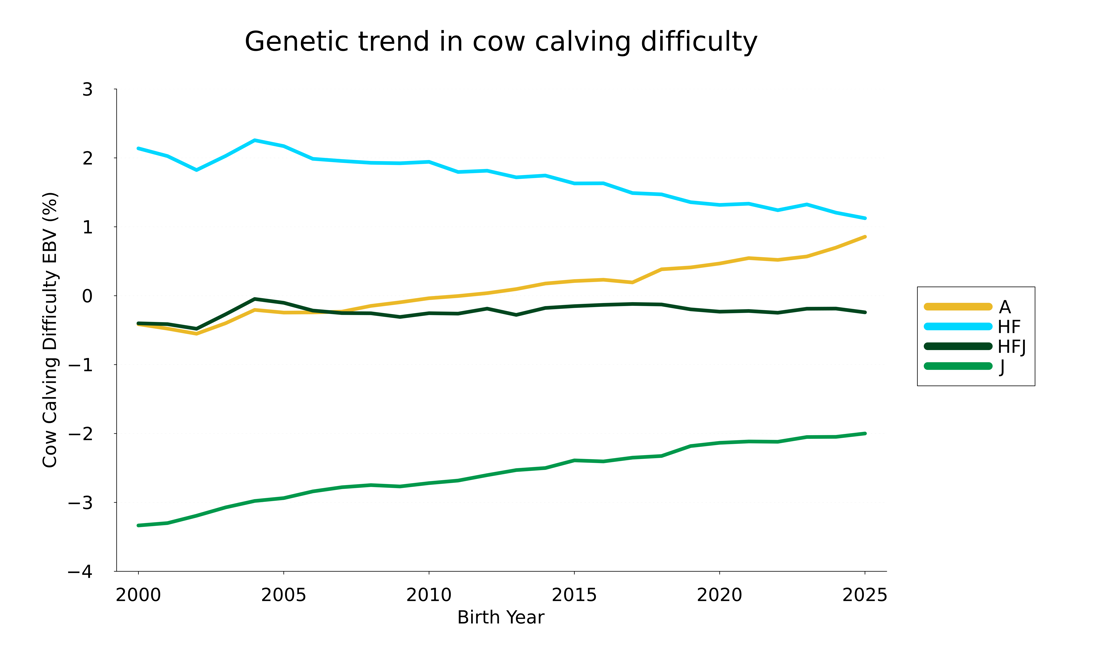
The graphs below show how the genetic merit of cows in the national herd is trending for individual traits.
The colours and abbreviations are as follows:
The graphs below are updated annually, typically in December; these were last updated December 2025.
Over the past decade, the national herd has increased its average Breeding Worth by $20 per year. Holstein-Friesians achieved an annual gain of $22, followed by Holstein-Friesian–Jersey crosses at $21. Jerseys increased by around $16 per year, and Ayrshires recorded a gain of about $10 annually.
Now’s the perfect time to check in, plan, and set up for a strong season. We’ve pulled together smart tips and tools to help you stay ahead all winter long.
Whether you prefer to read, listen, or download handy guides, we’ve got you covered with trusted tools to support your journey every step of the way.
Put our proven strategies and seasonal tools to work. Boost production, support animal health and watch your profits hum.
Tools that are backed by science, shaped by farmers and made for this season.
That’s Summer Smarts.
Autumn Smarts brings together the research-backed tools that build resilience and boost performance.