Assessing Plantain
Topics
2 min read
Plantain in pastures can reduce nitrate leaching by affecting nitrogen in urine and soil retention. This page teaches you the importance of assessing the proportion of plantain in your pasture. You might need to show evidence of its effect on nitrate leaching to regional councils in some areas. It's best to assess close to grazing time, especially in Autumn when pastures grow actively. Use a visual method to estimate plantain percentages. Walk across paddocks, identify plantain amounts, and record them.
Plantain can reduce nitrate leaching by reducing the amount and concentration of nitrogen in urine, and by retaining more nitrogen in the soil. The effectiveness of plantain pastures for reducing nitrate leaching depends on the proportion (%) of plantain relative to other species in the pasture.
The following is a guide to assessing the proportion of plantain in a pasture sward.
In some regions, farmers, rural professionals or environmental auditors will need to supply evidence (e.g., OverseerFM report) to their regional council to show the effect plantain could be having on their nitrate leaching.
OverseerFM can adjust the proportion of N in urine and the urine patch N load by predicting the amount consumed by ruminants when the average proportion (%) of plantain in the pasture is input into the model.
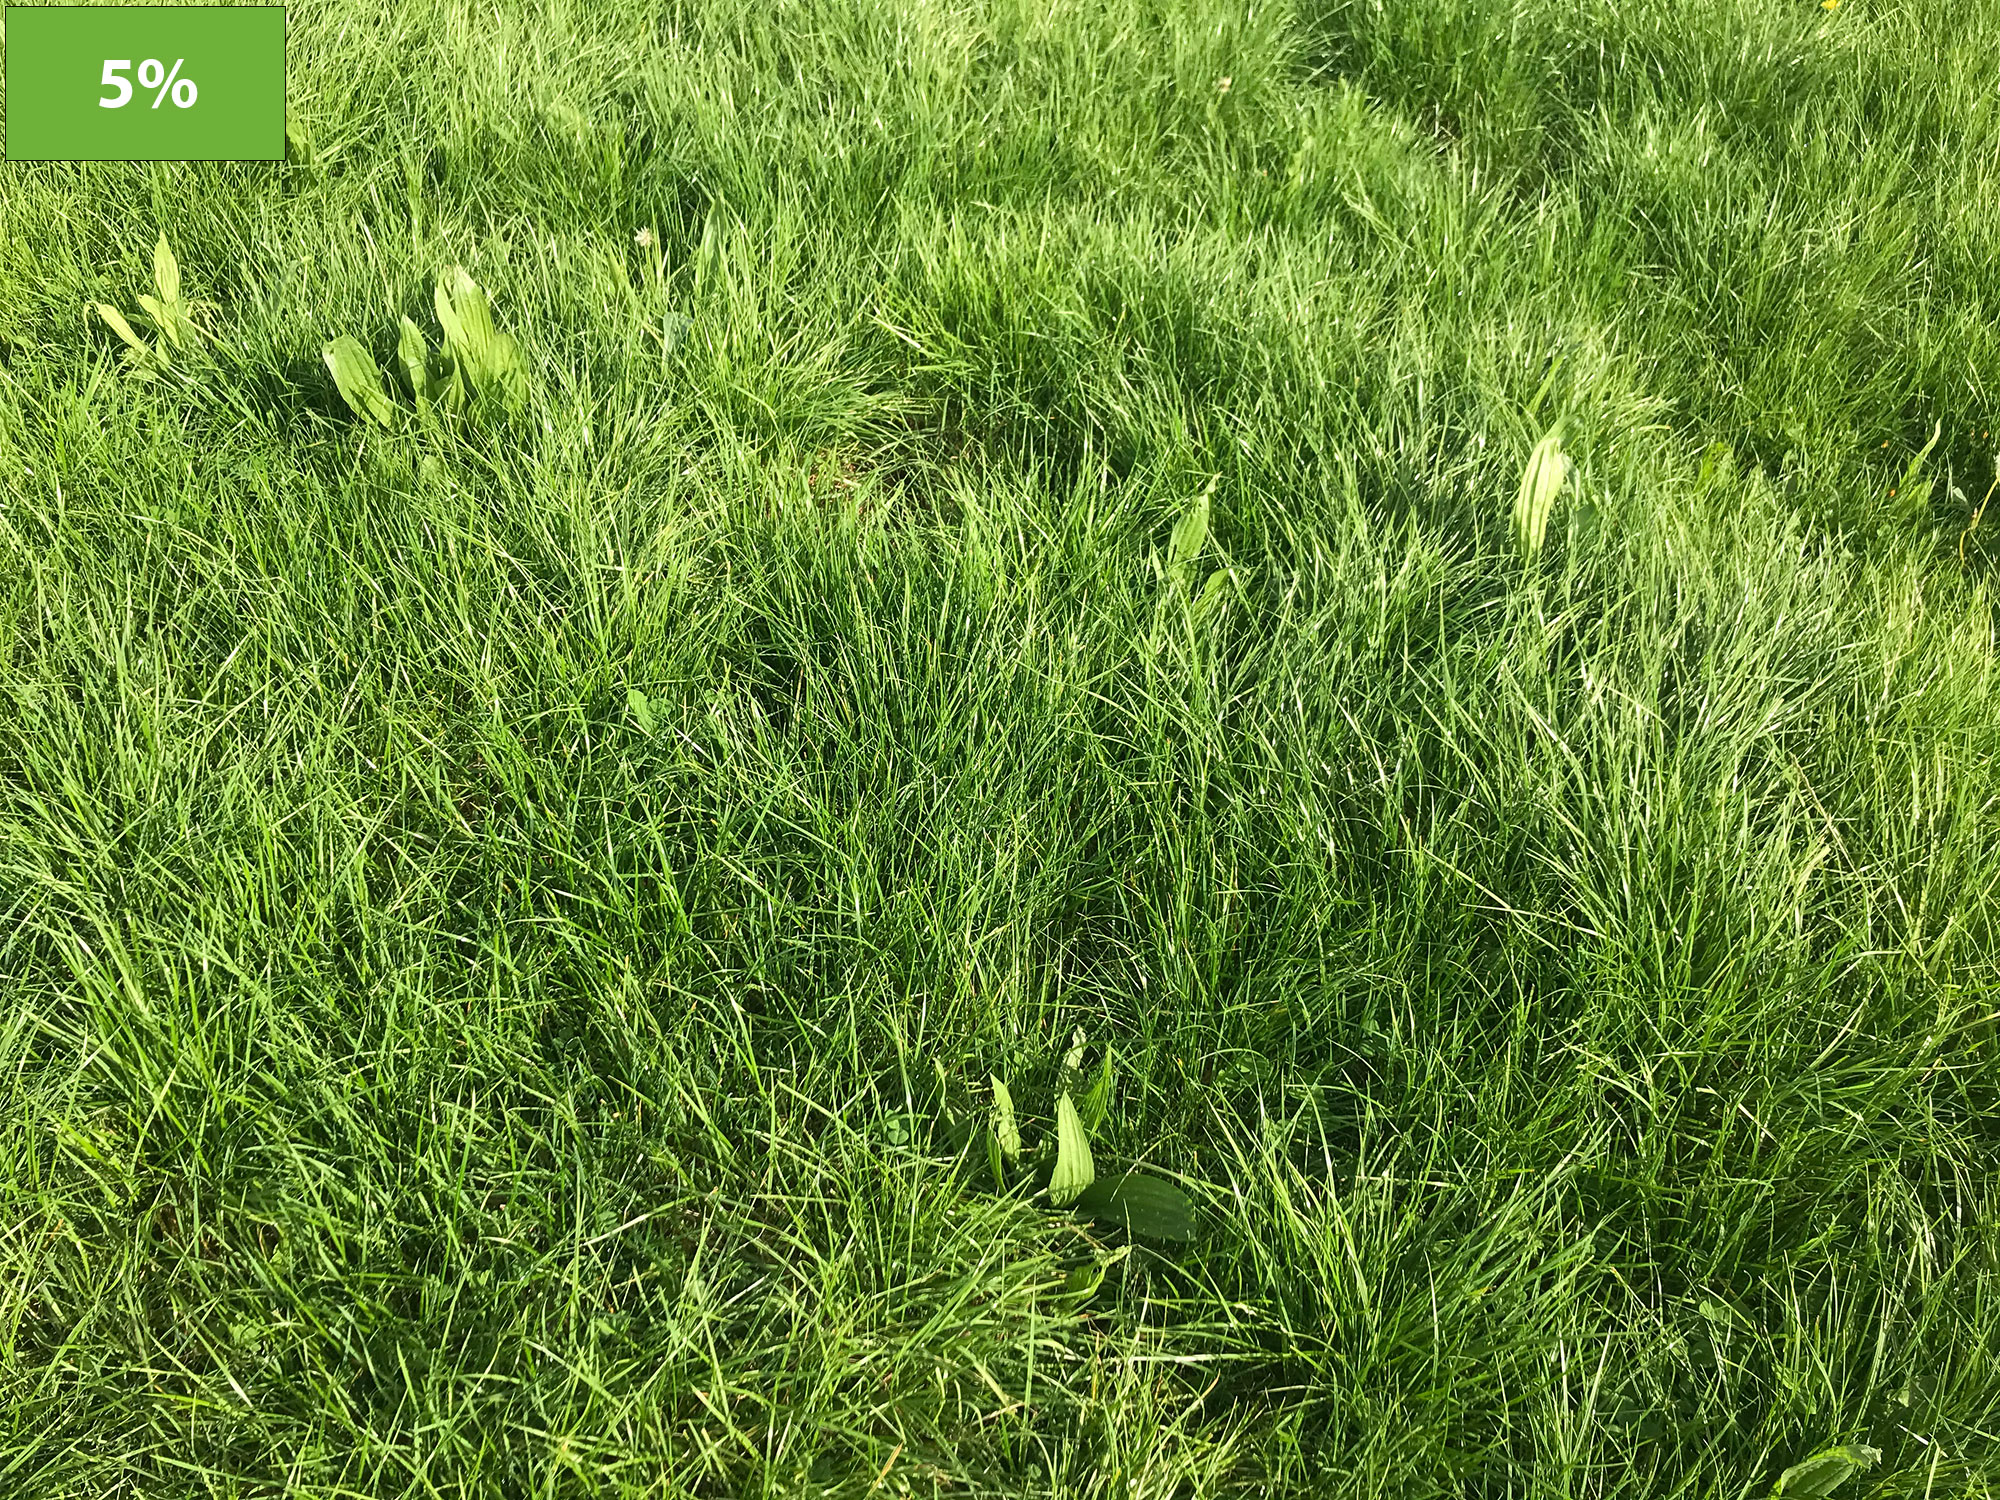
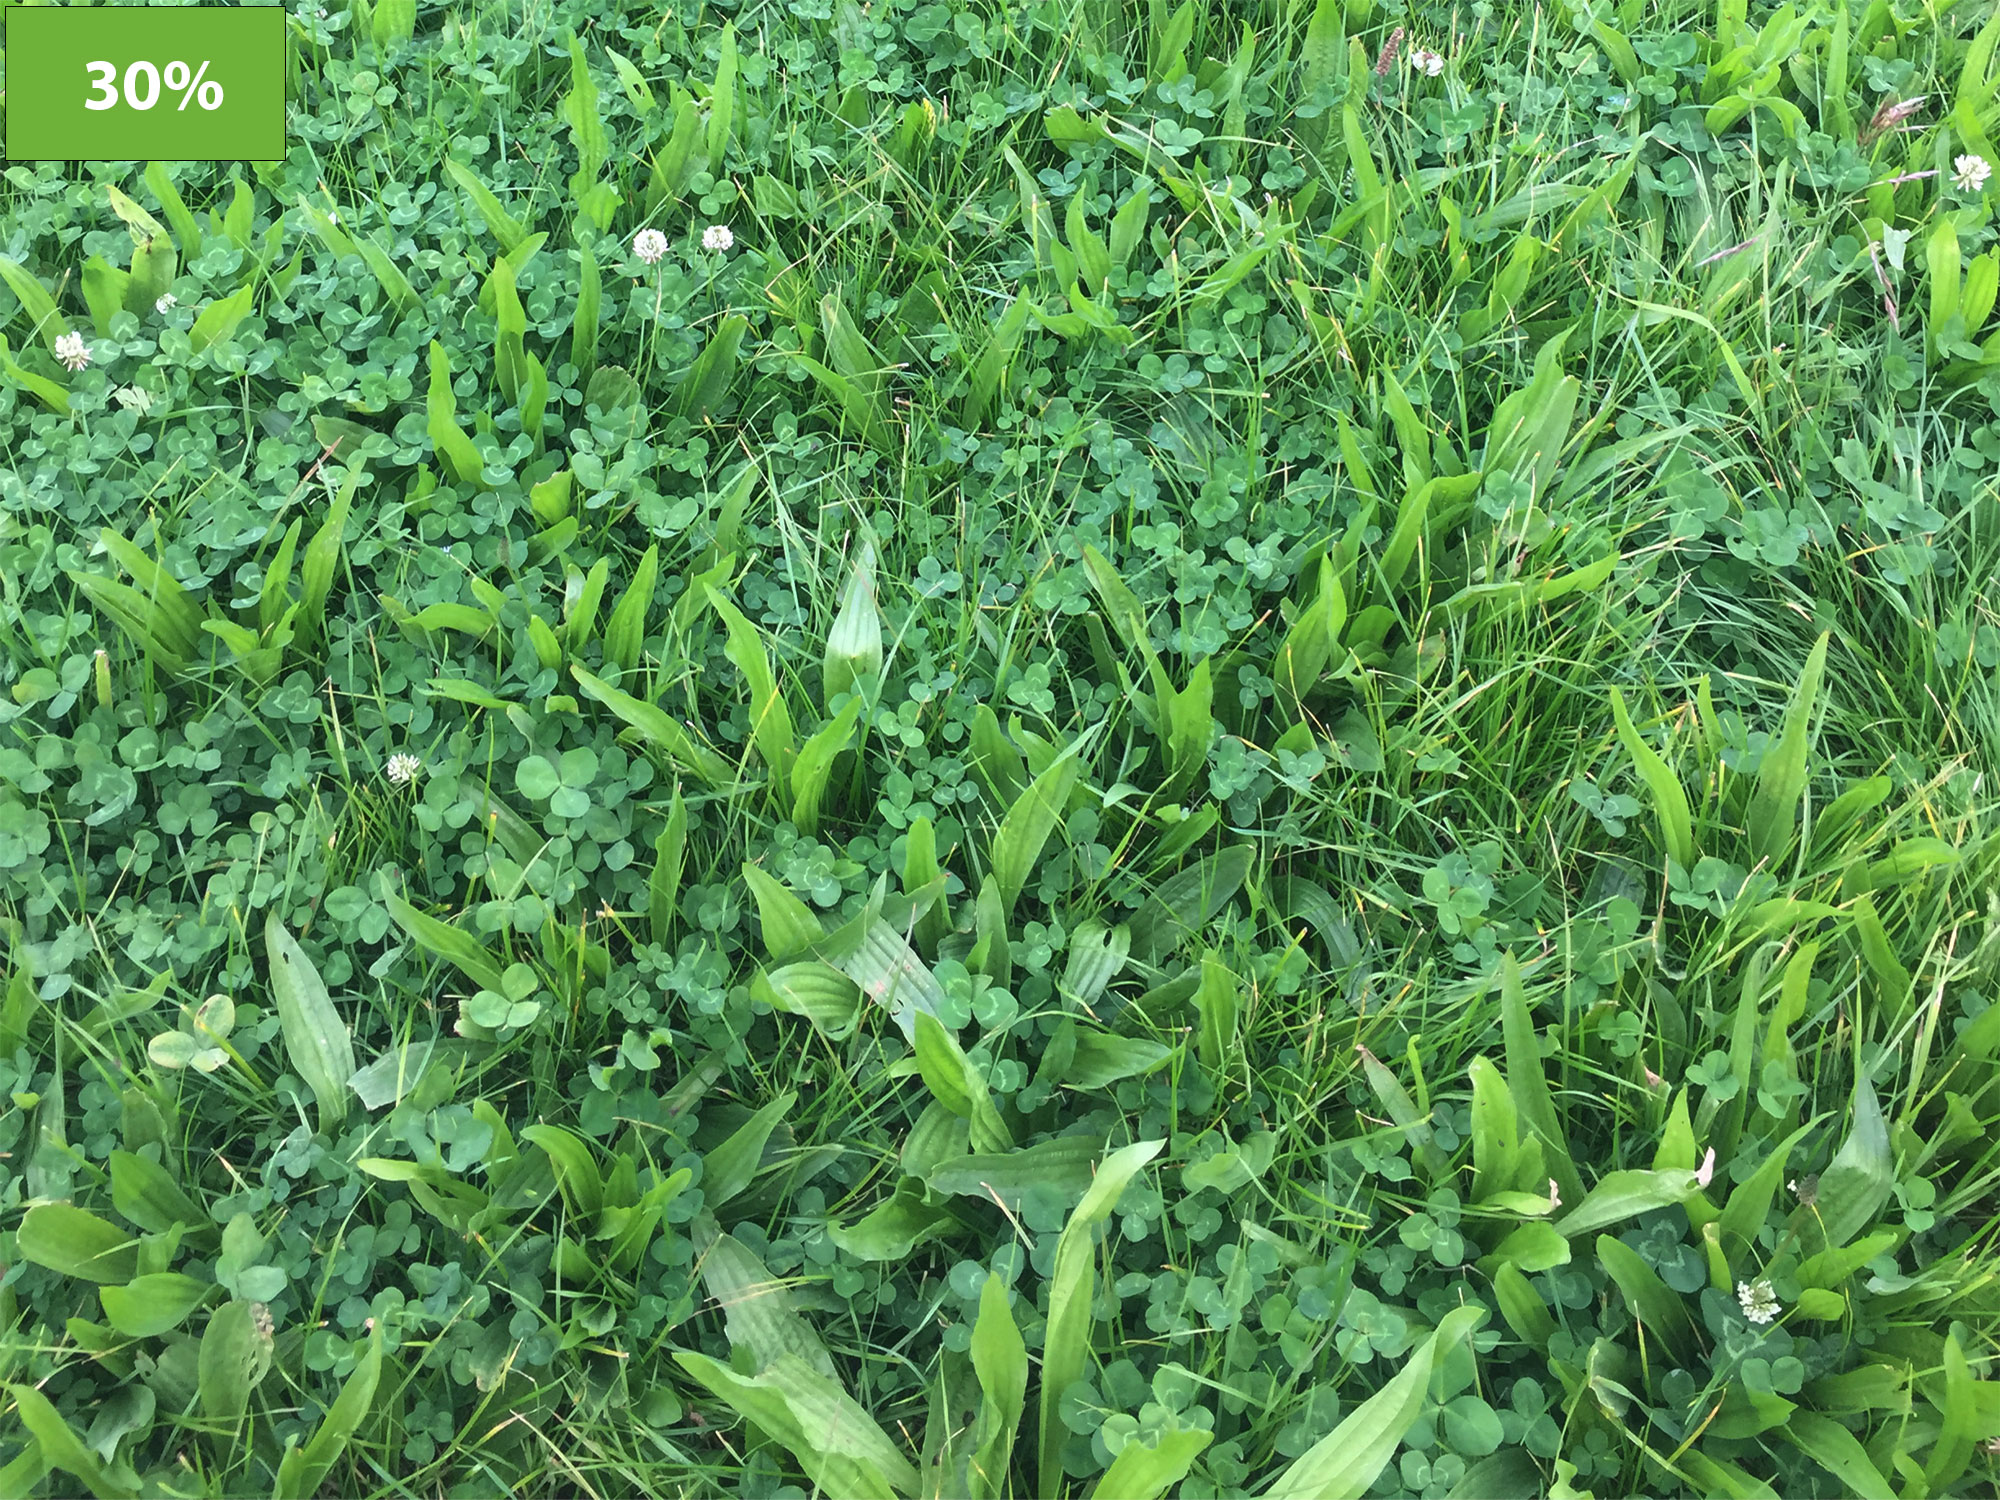
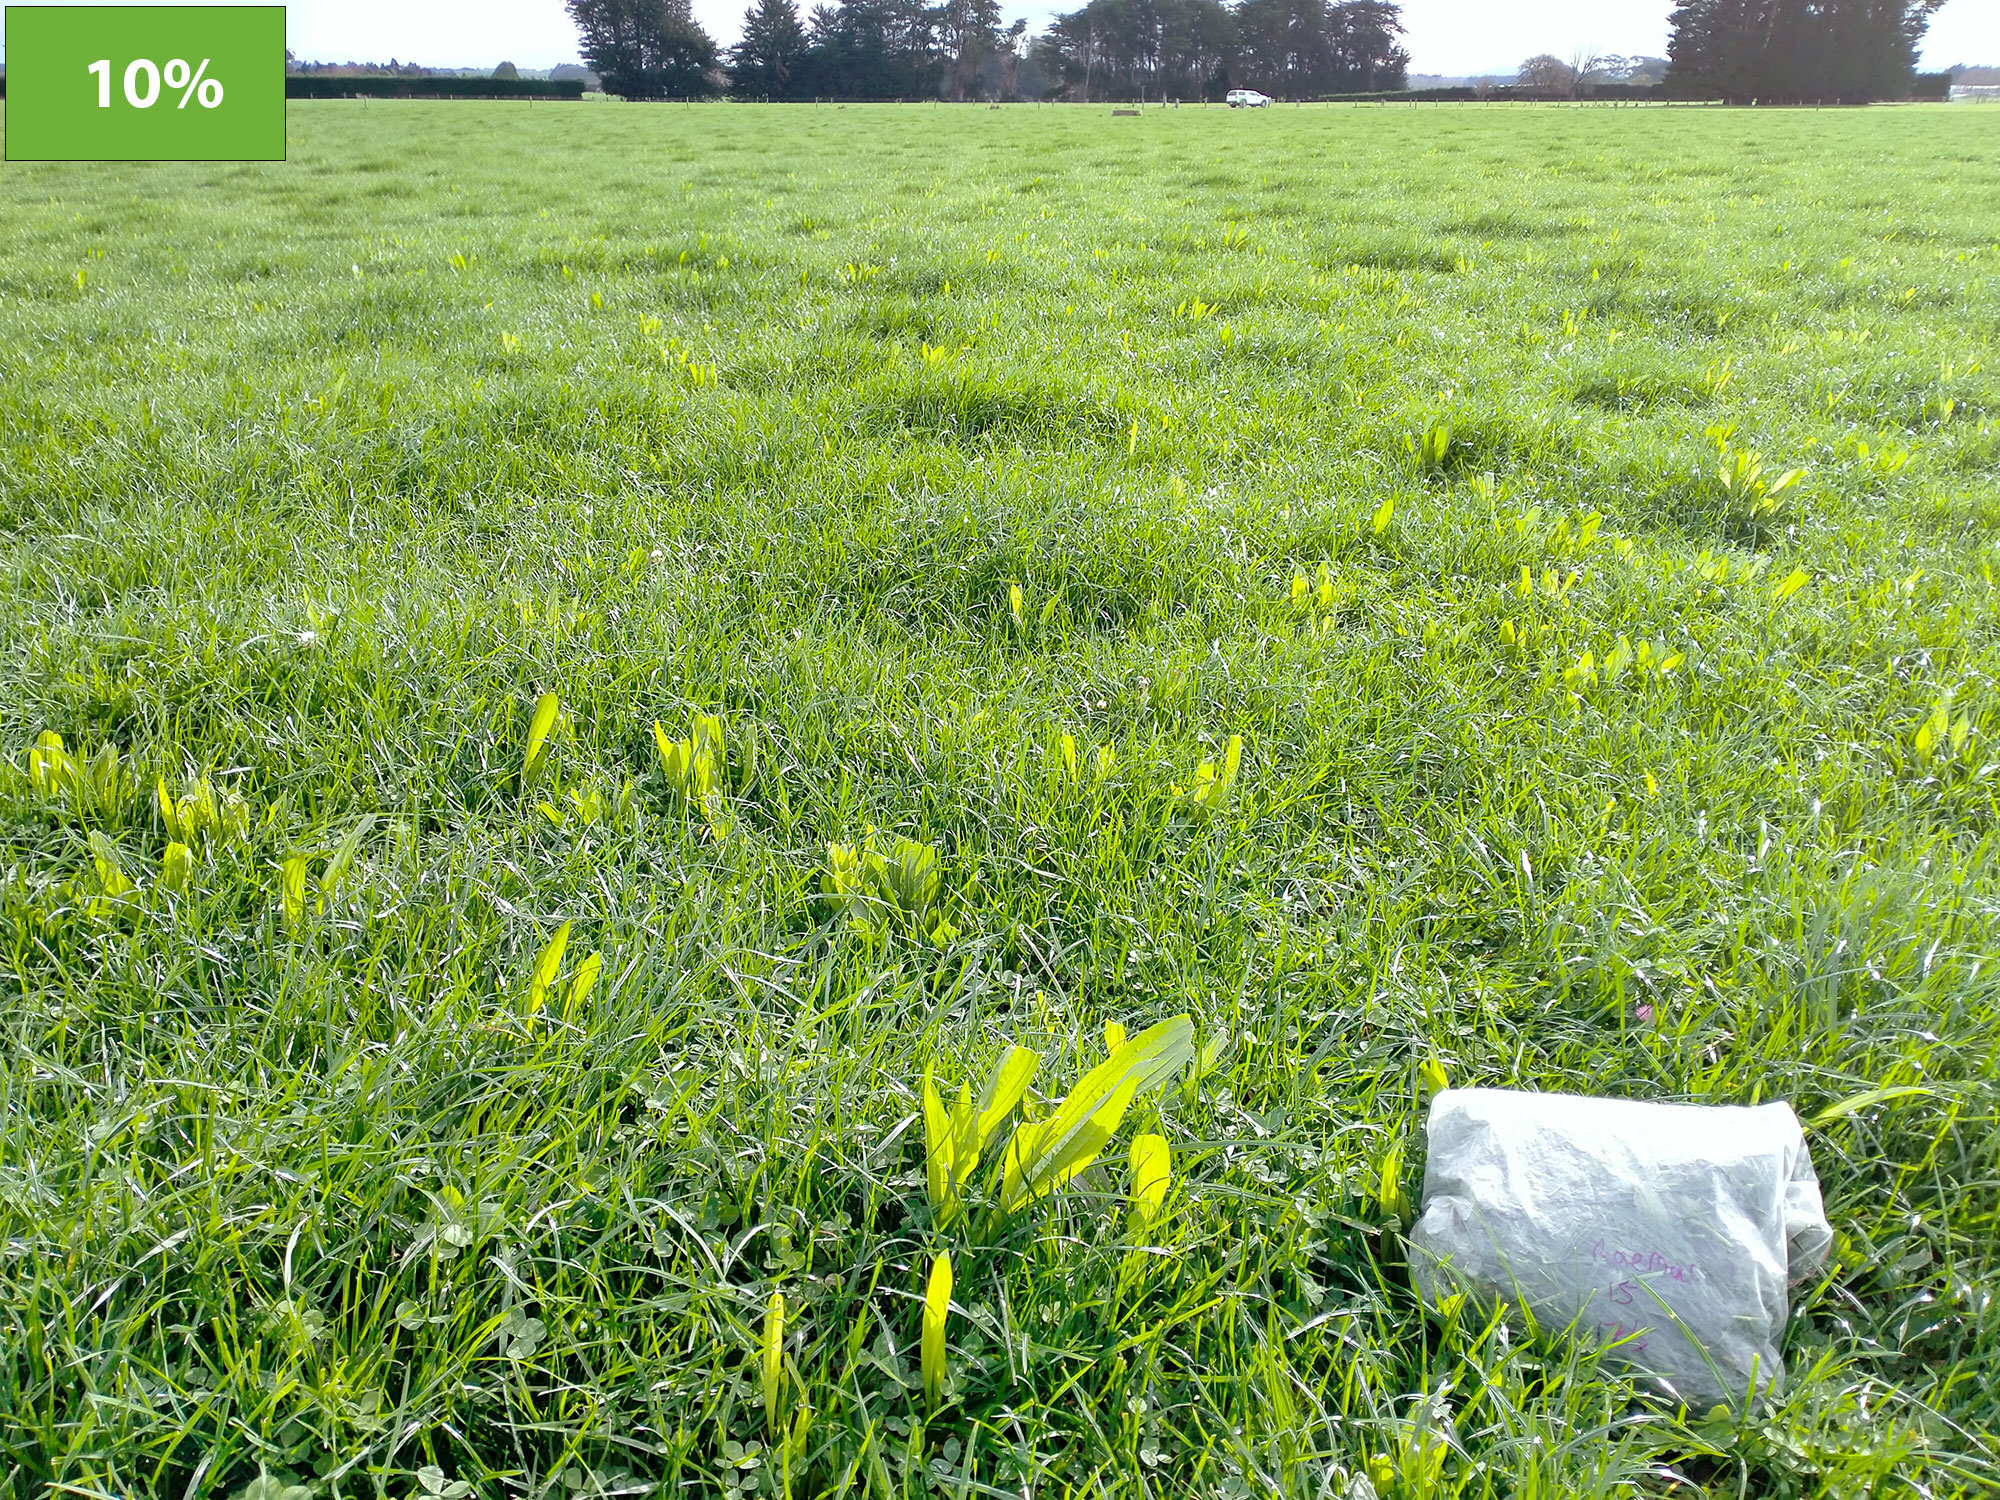
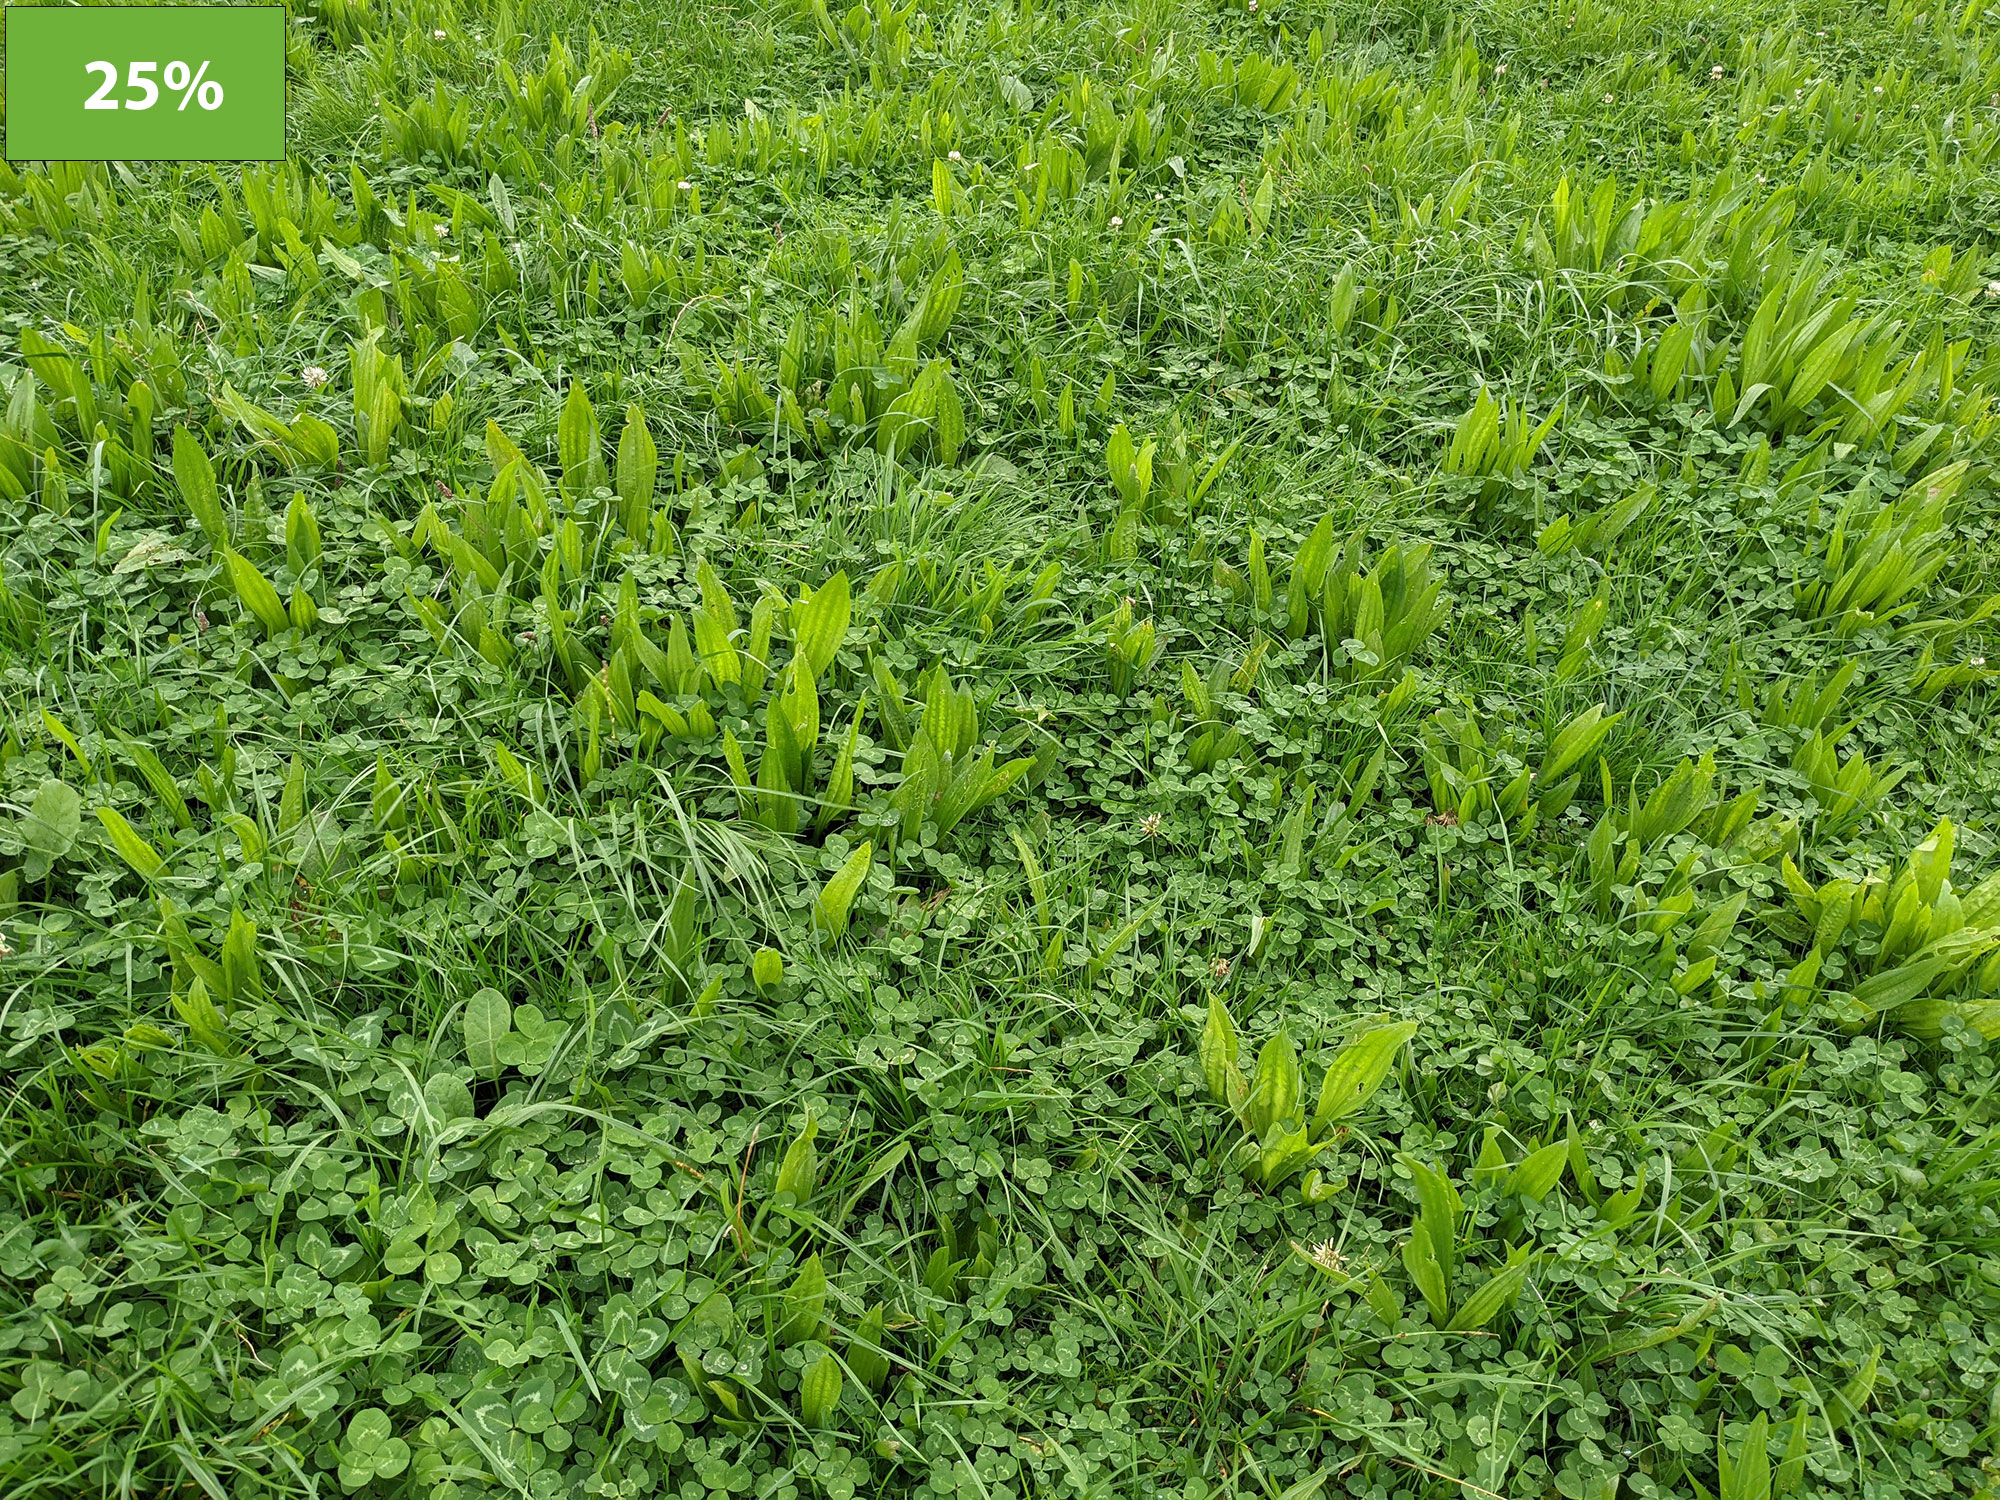
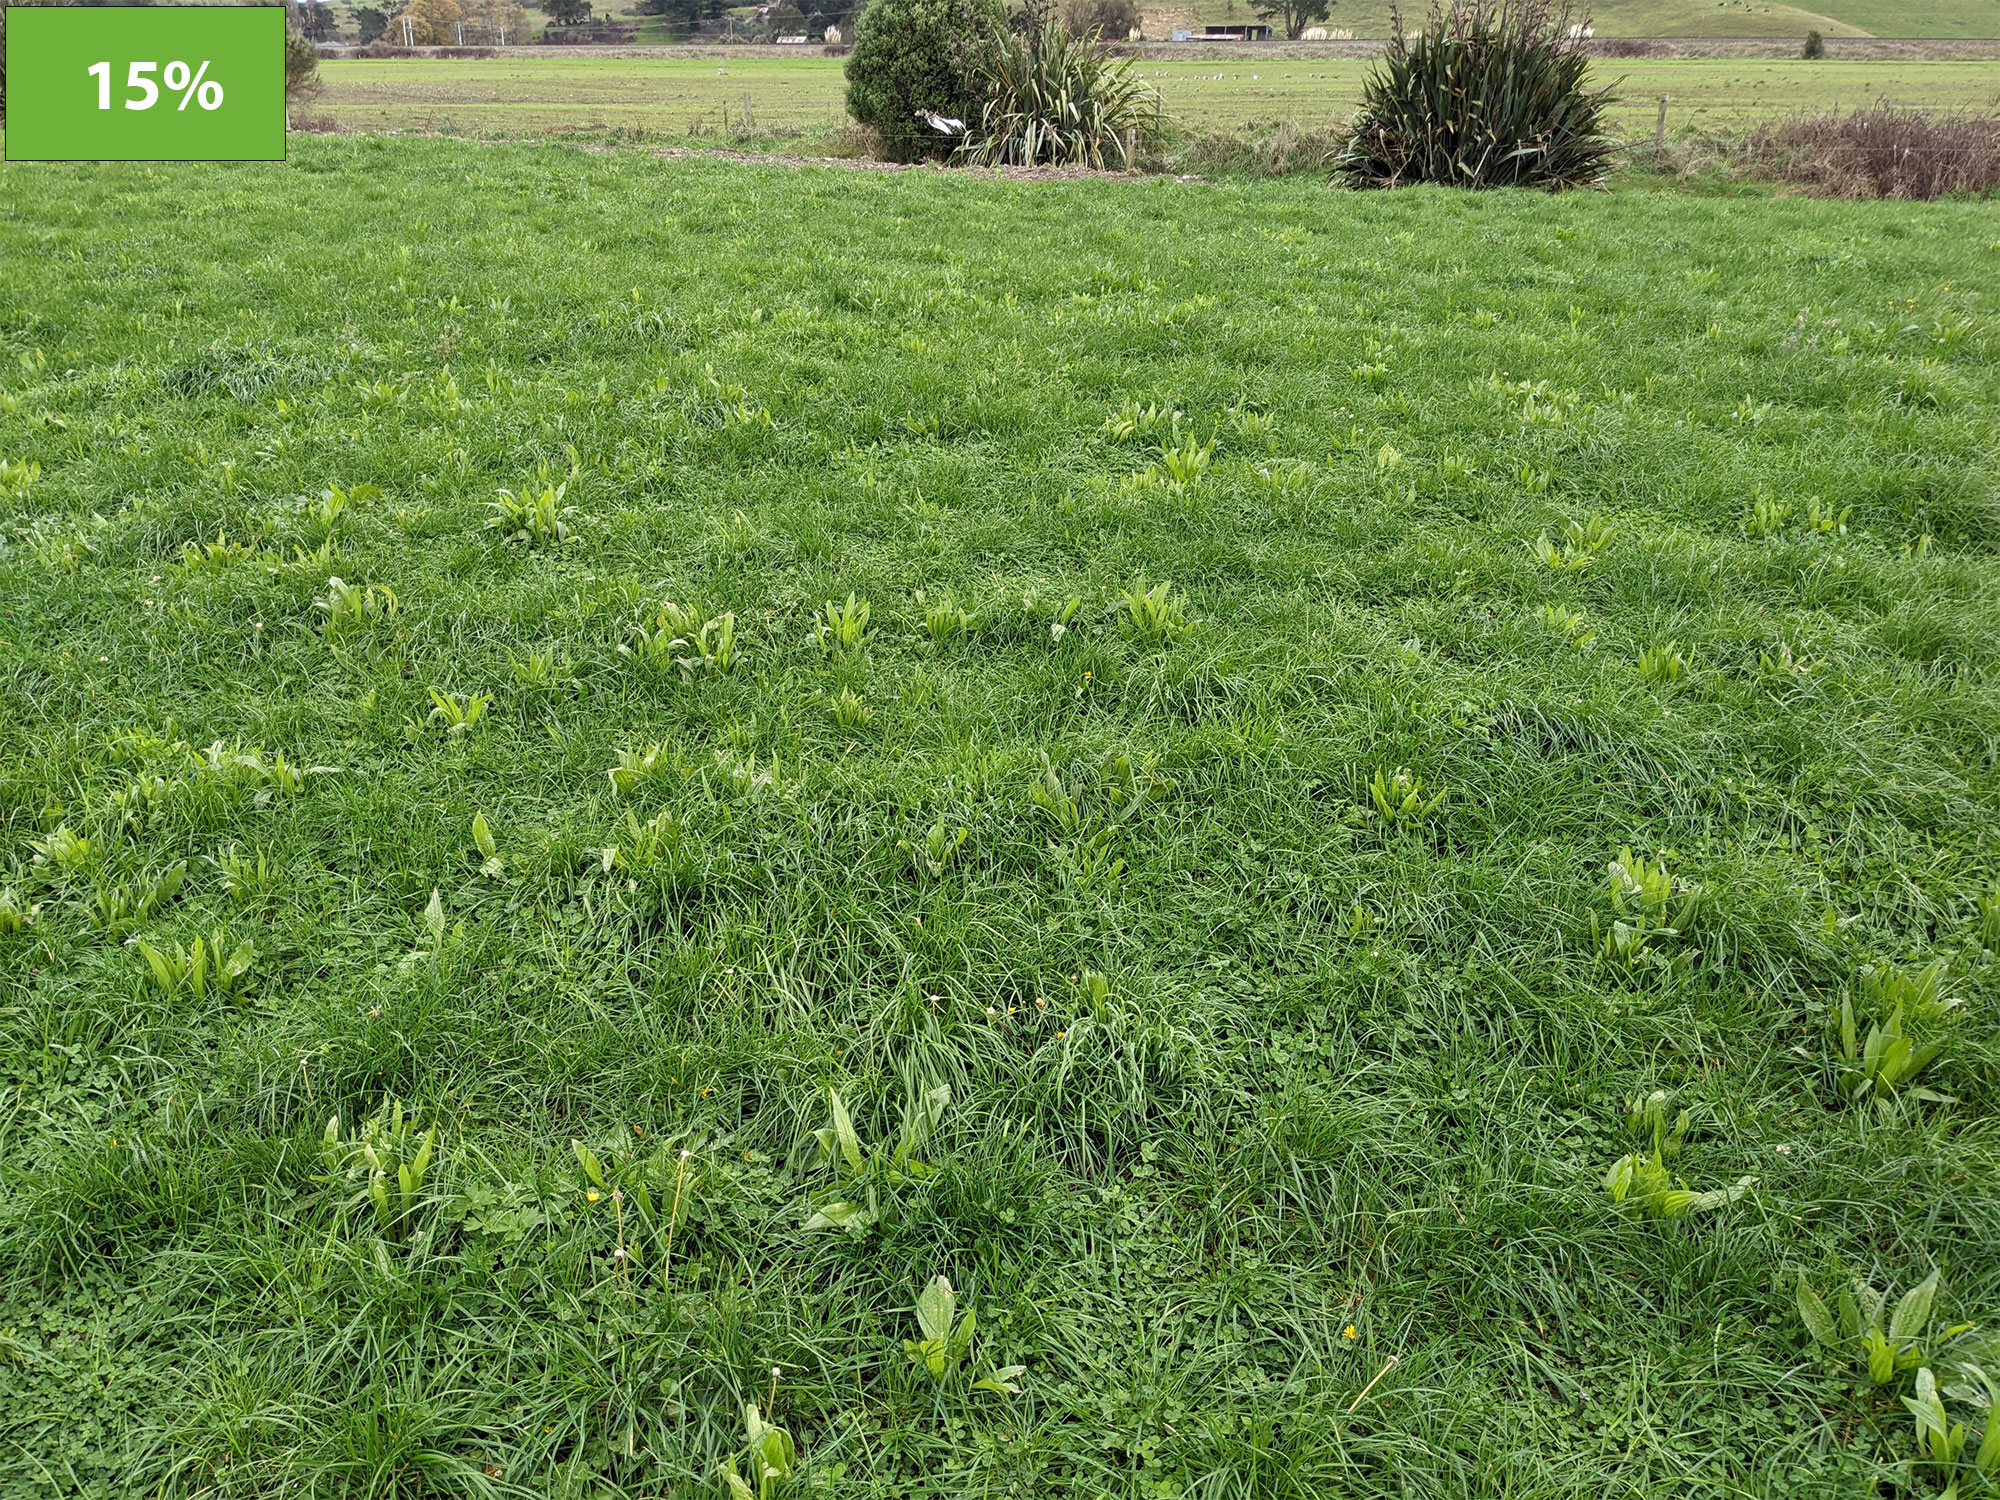
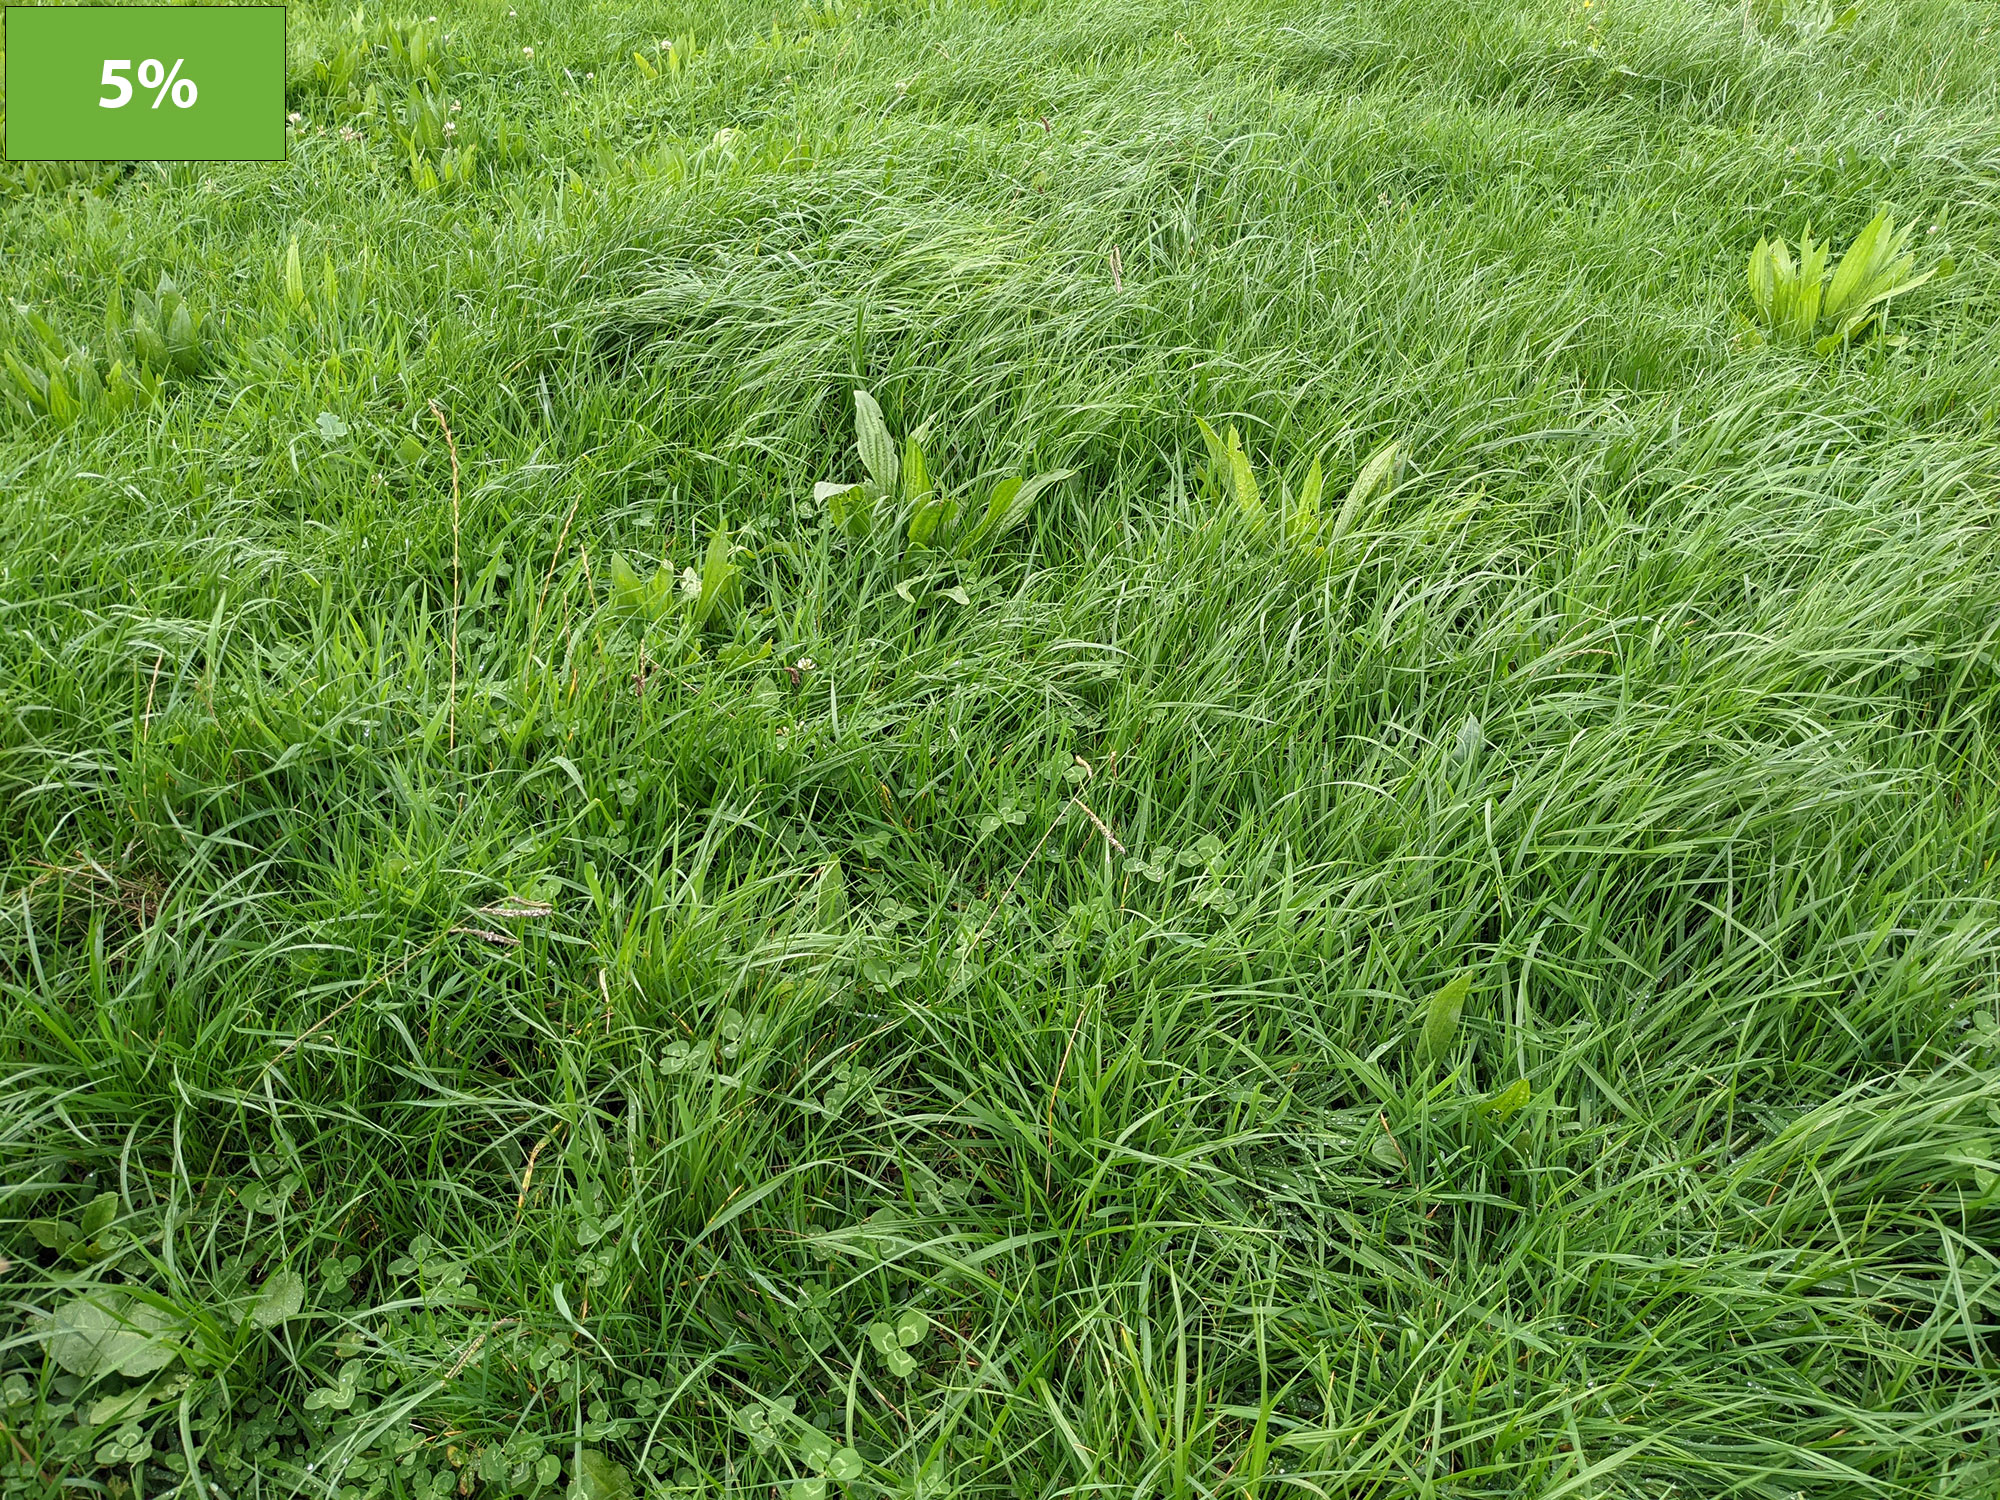
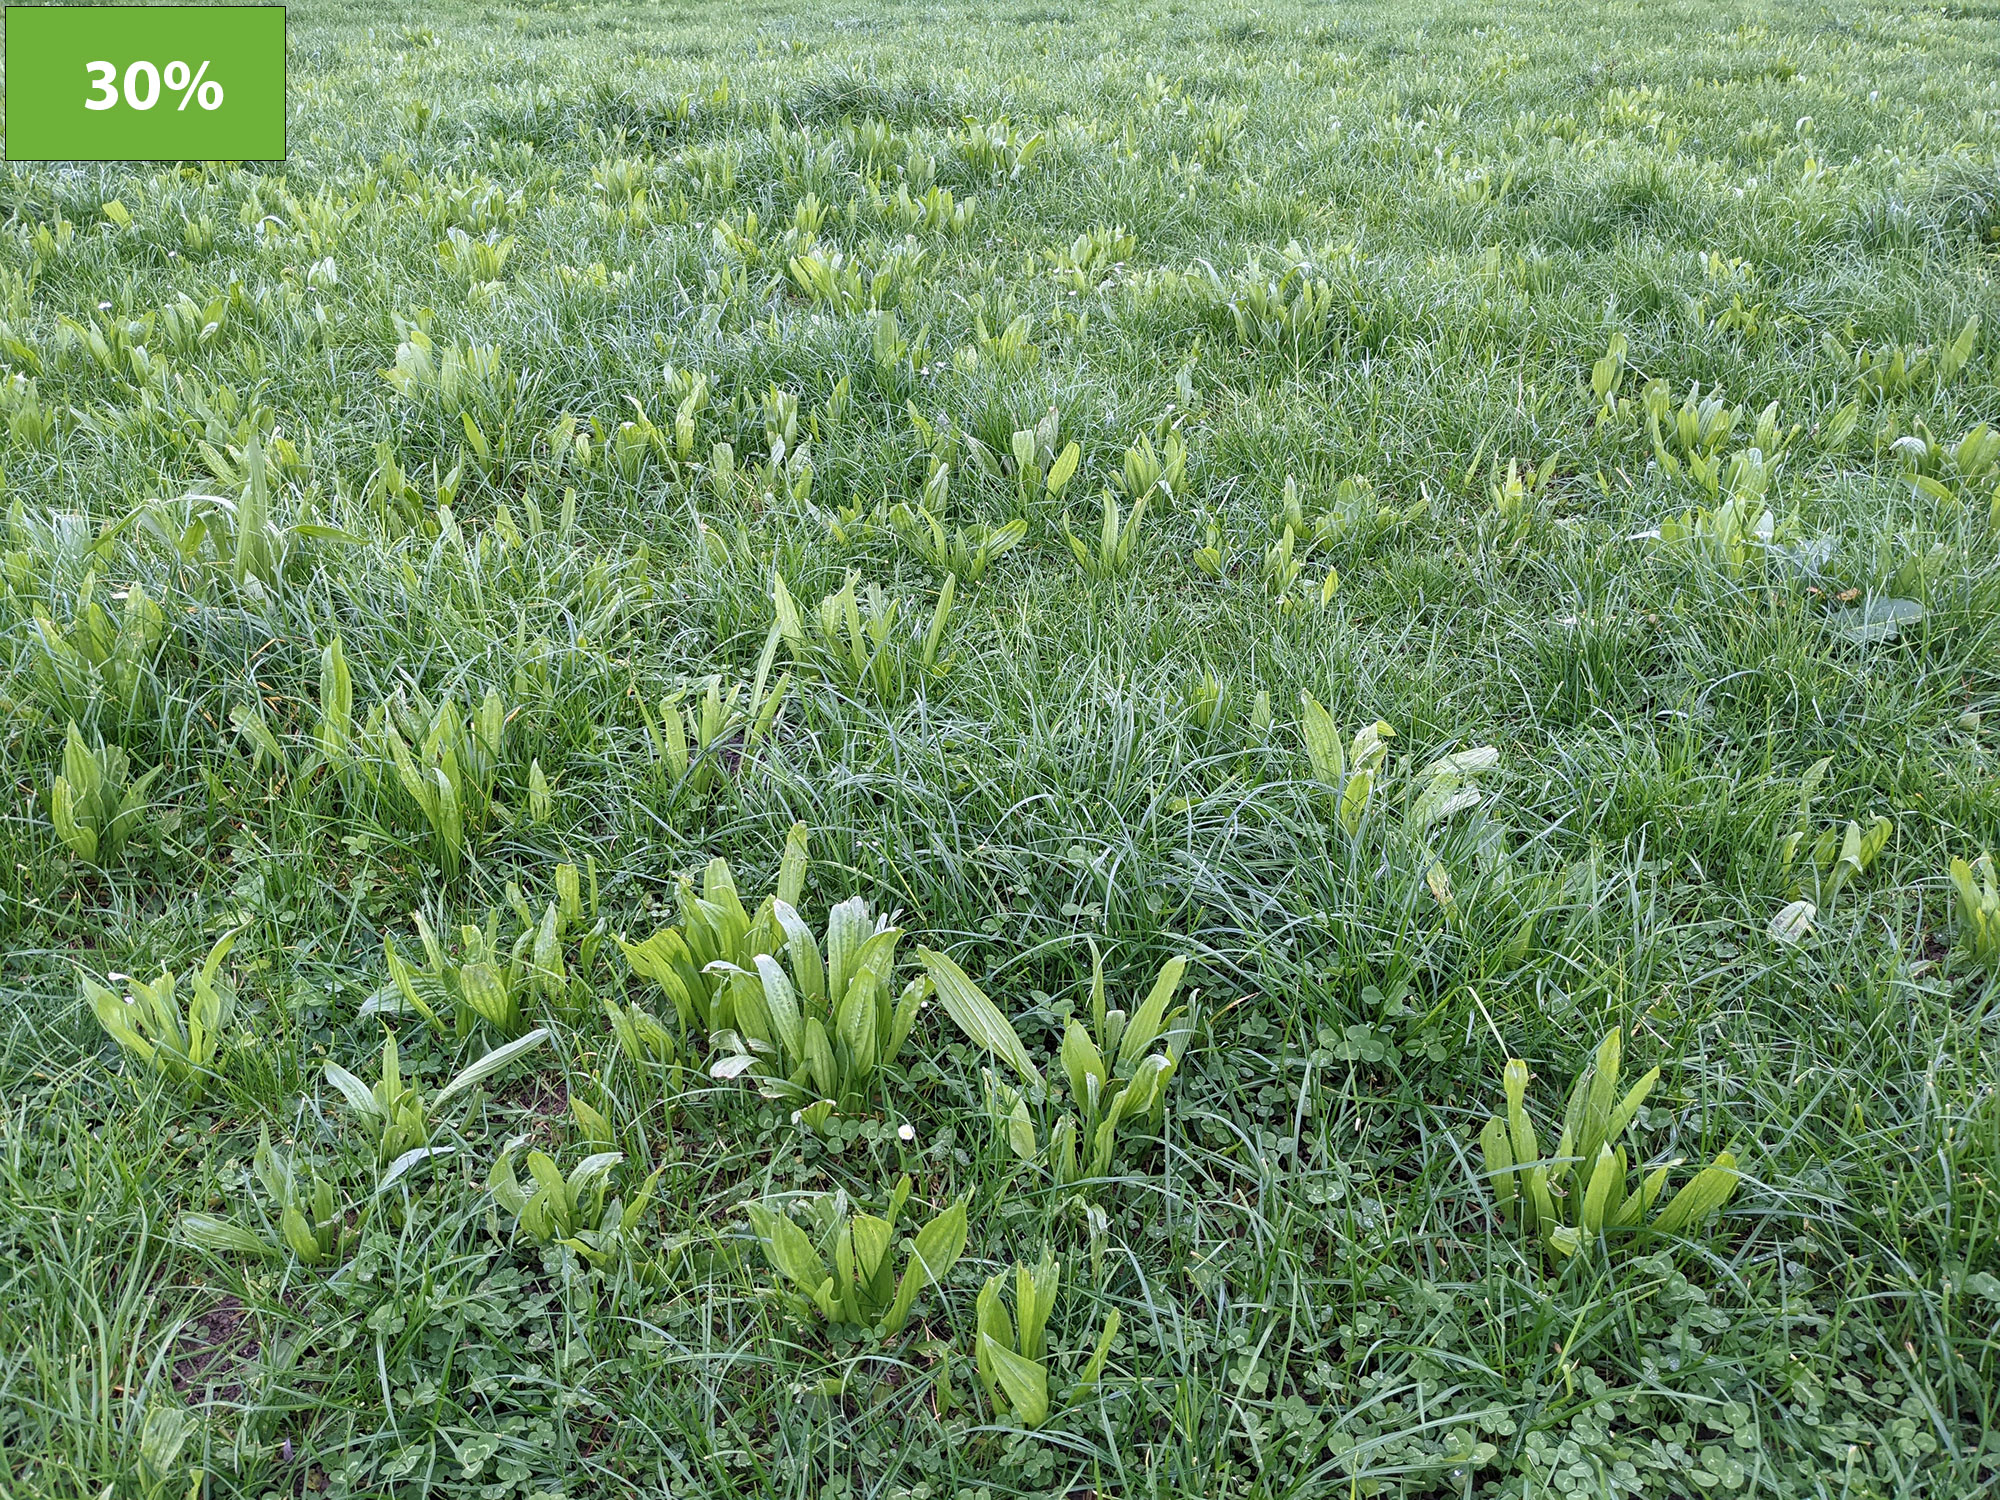
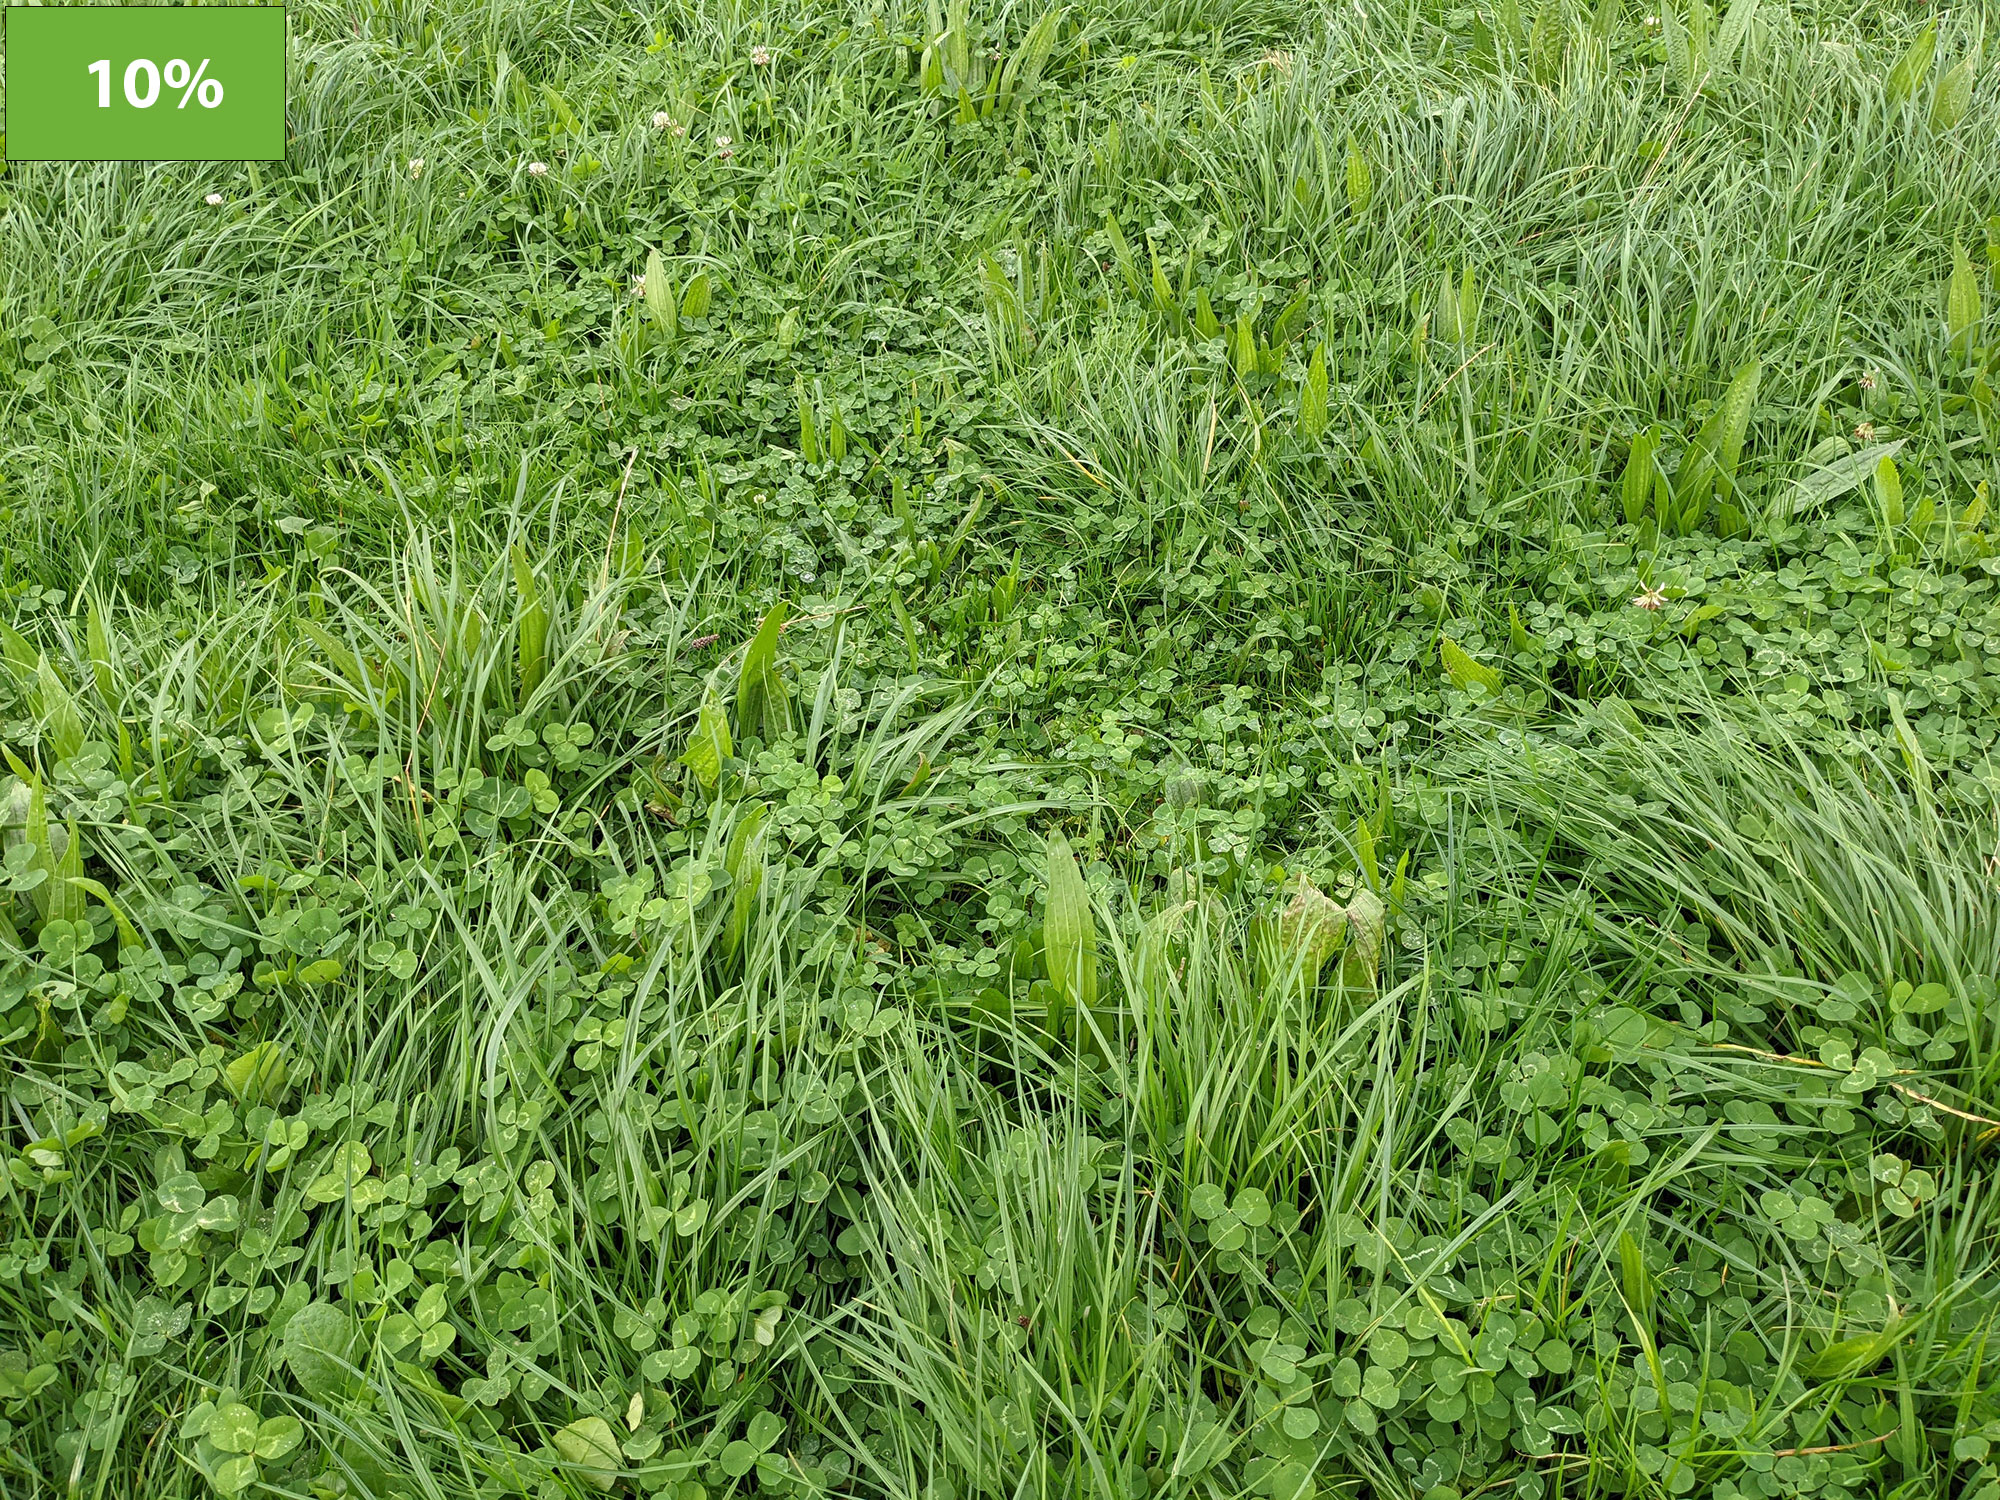
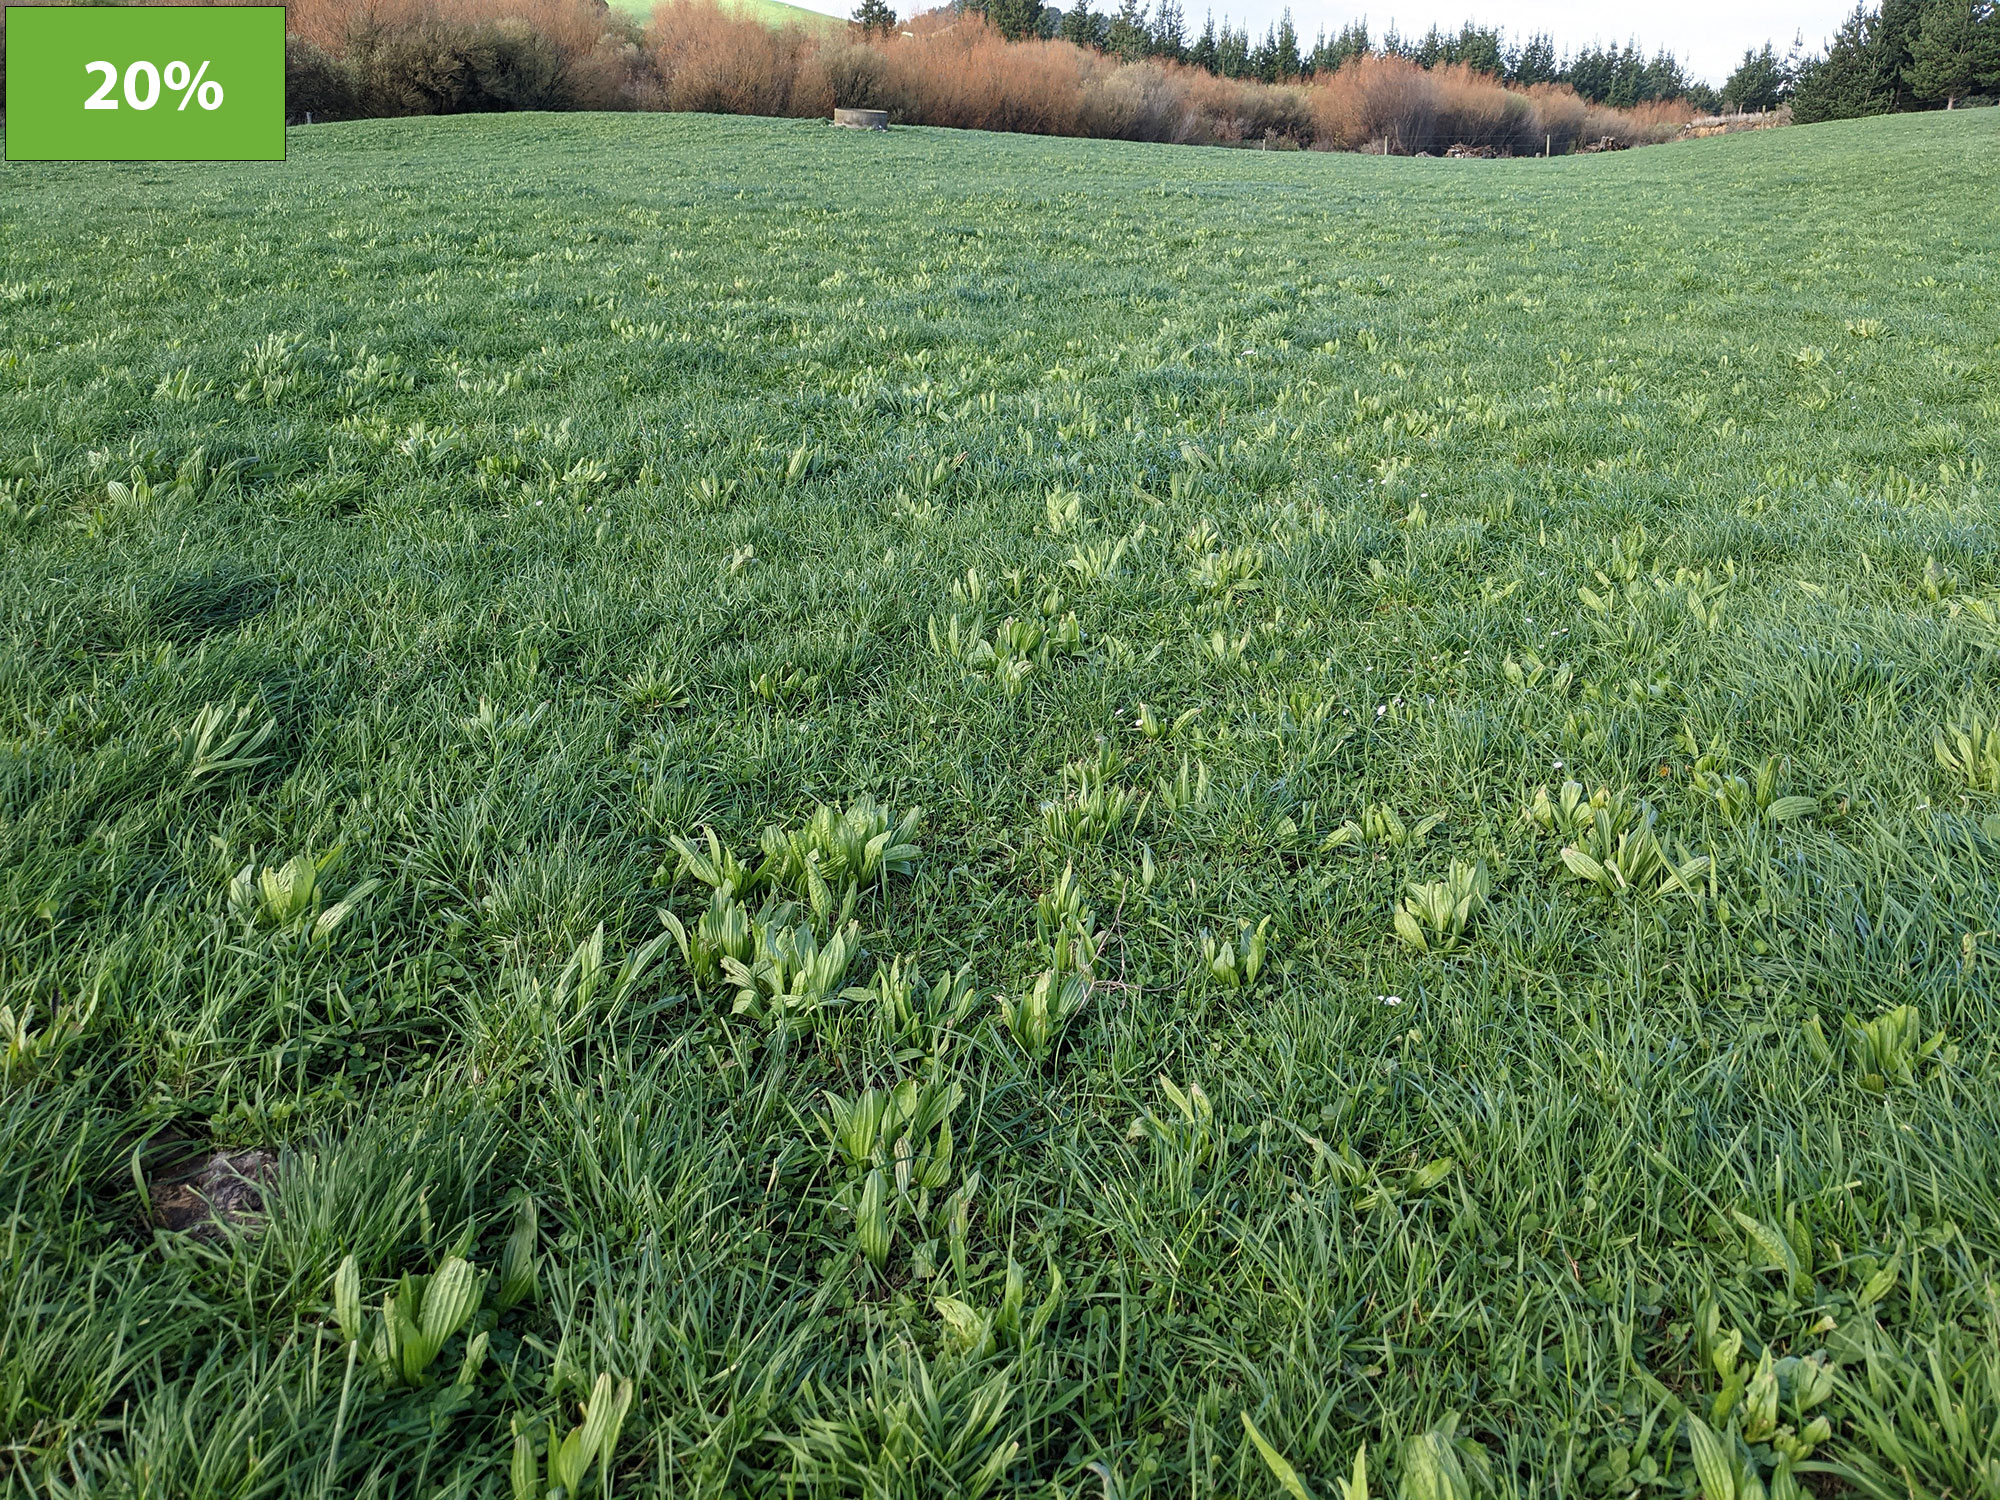
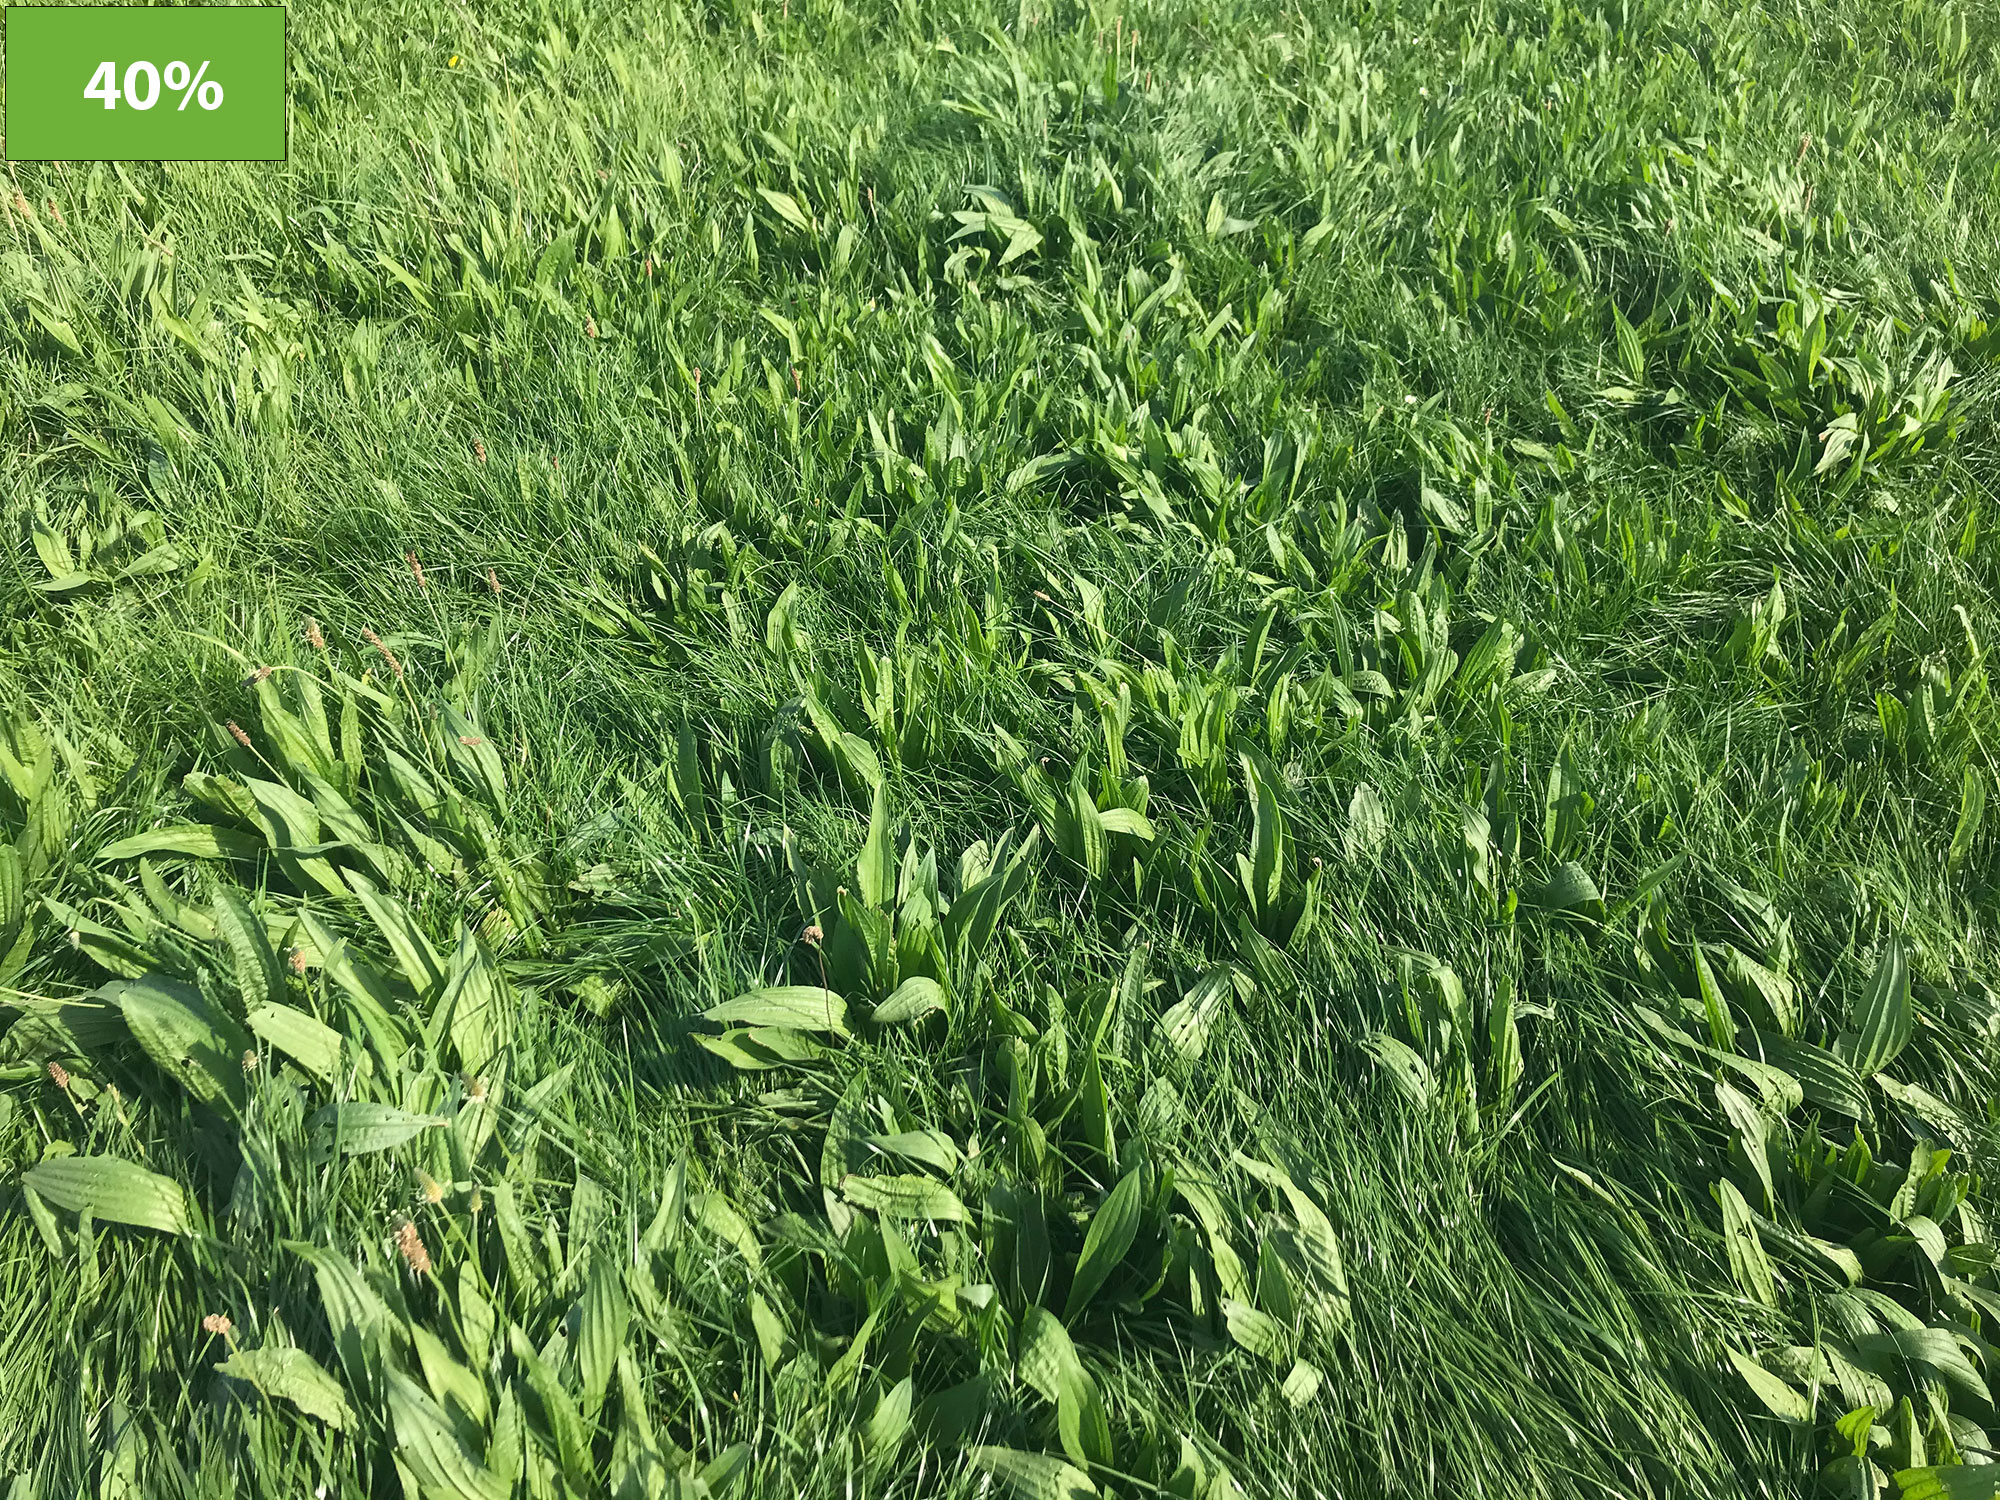
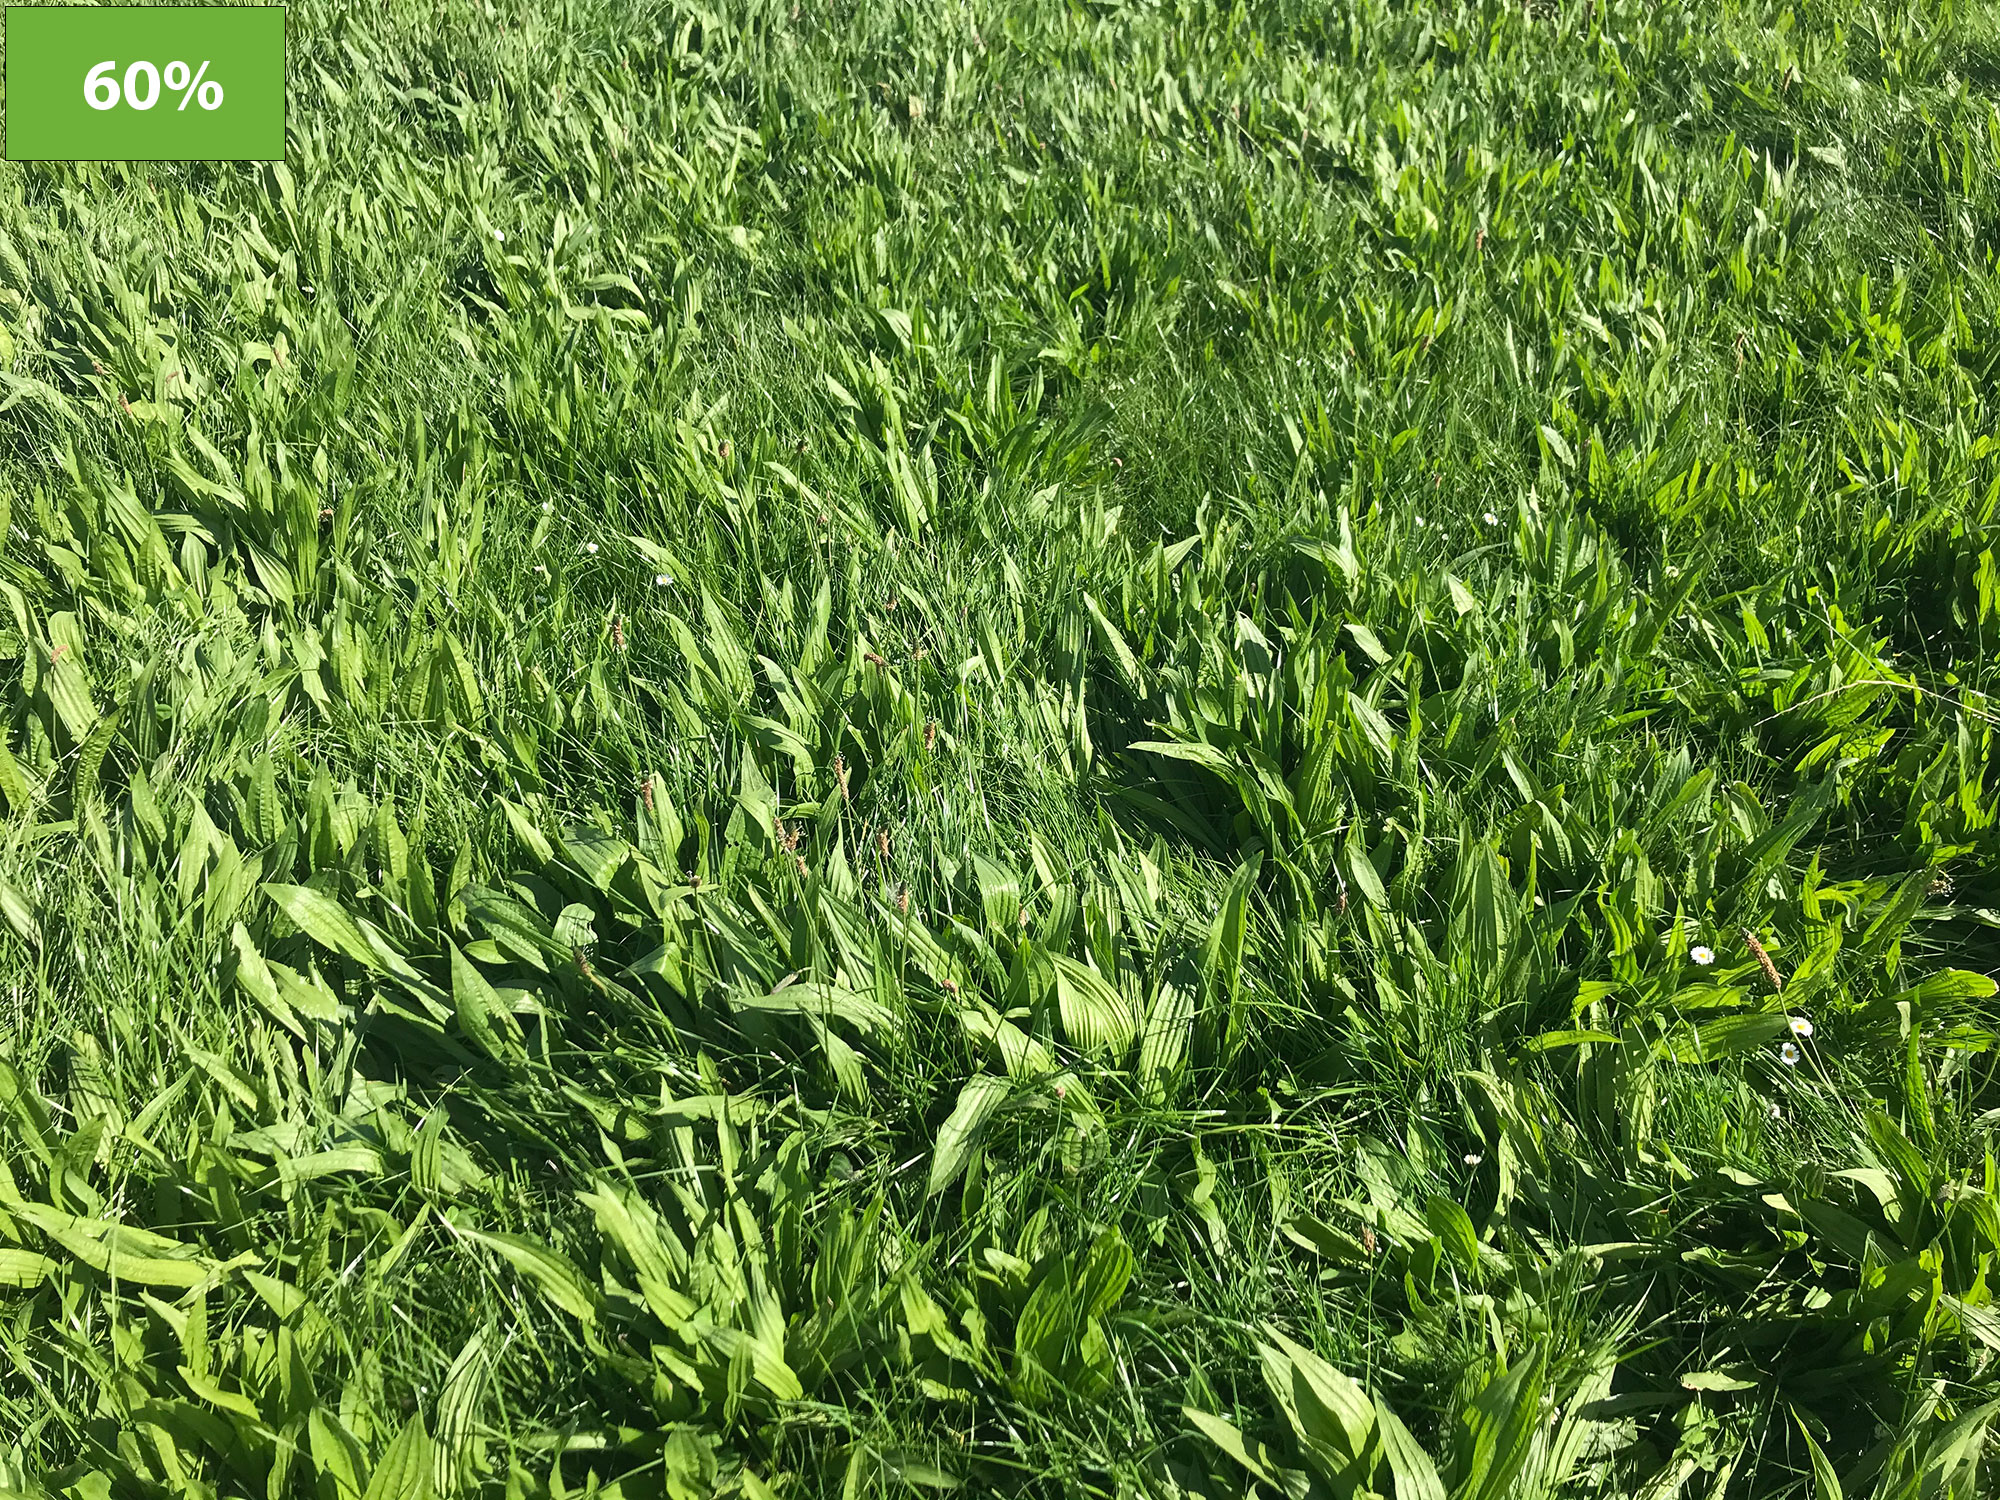
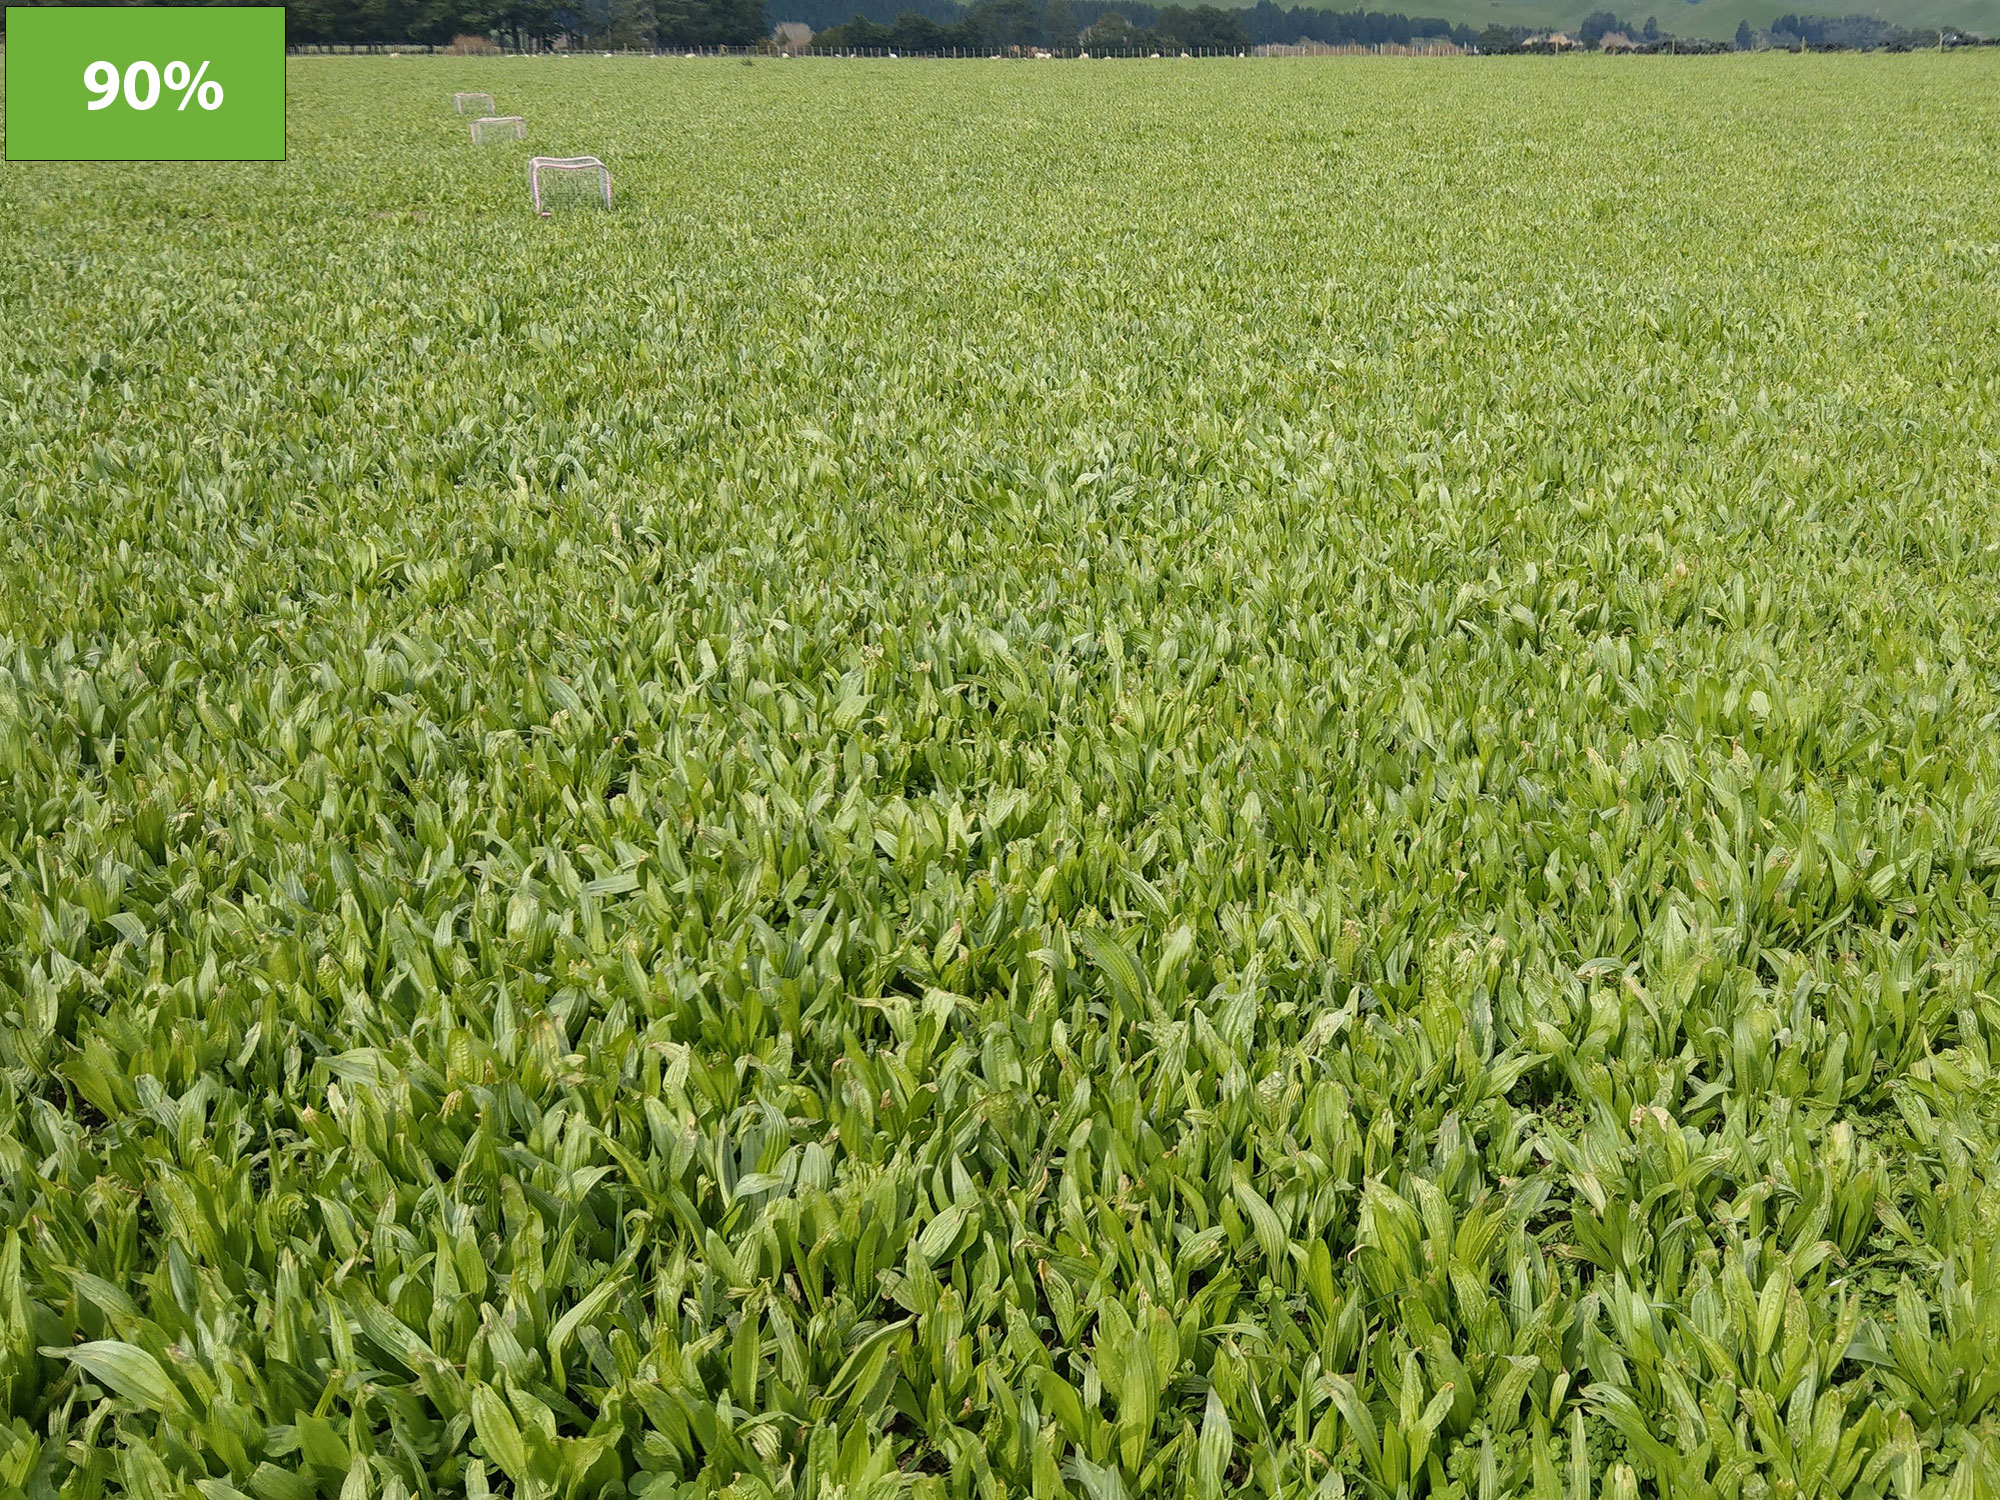
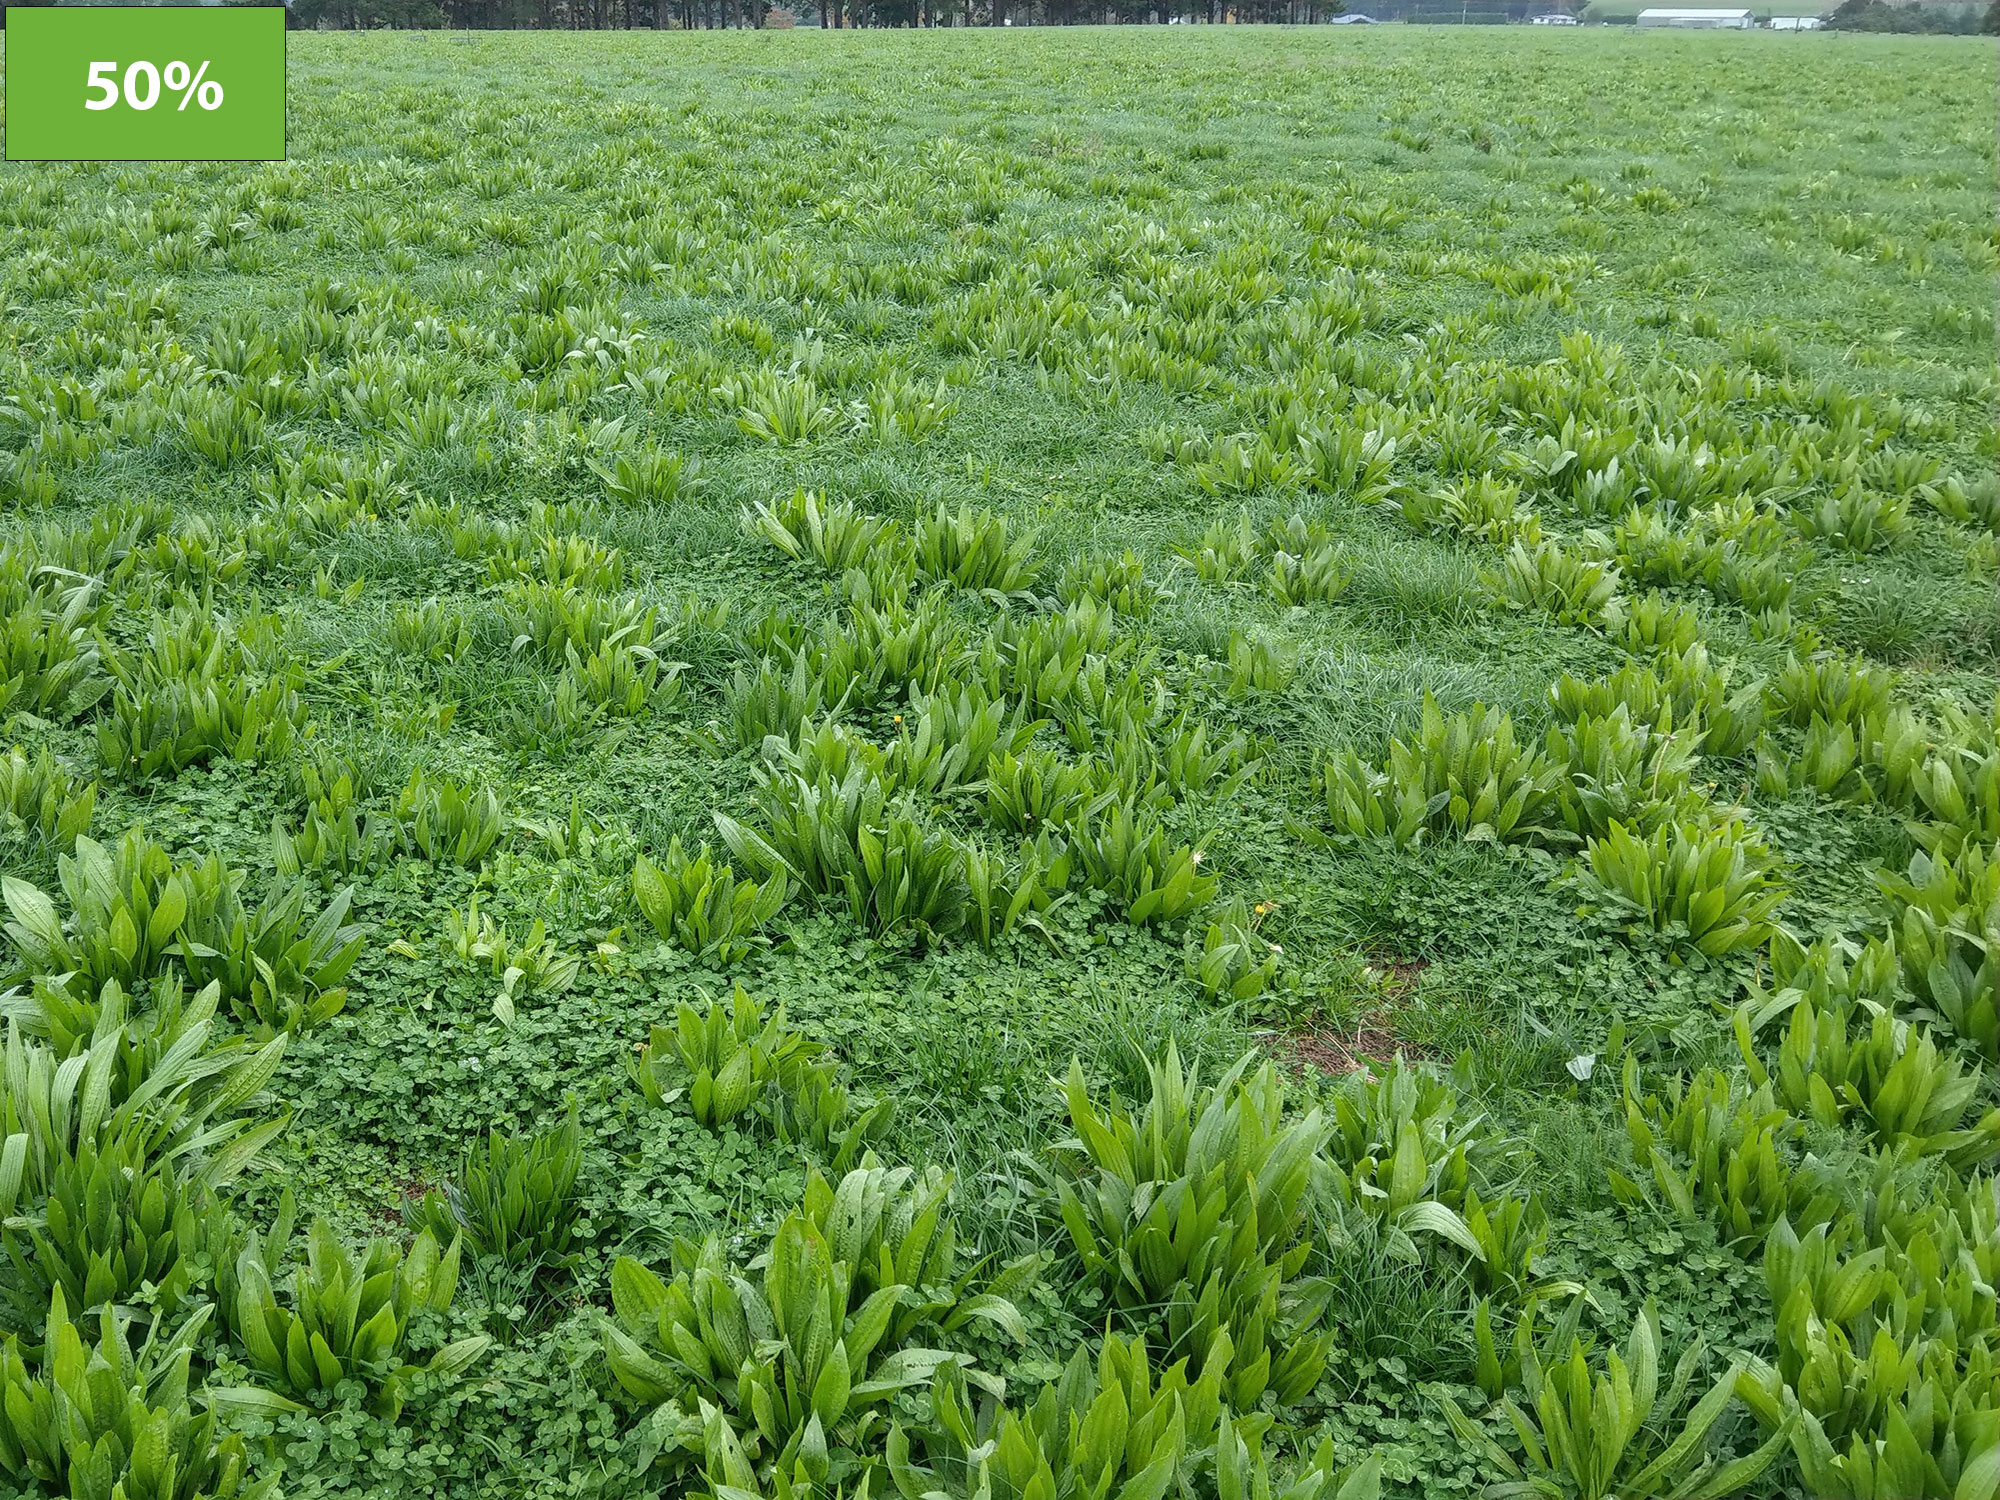
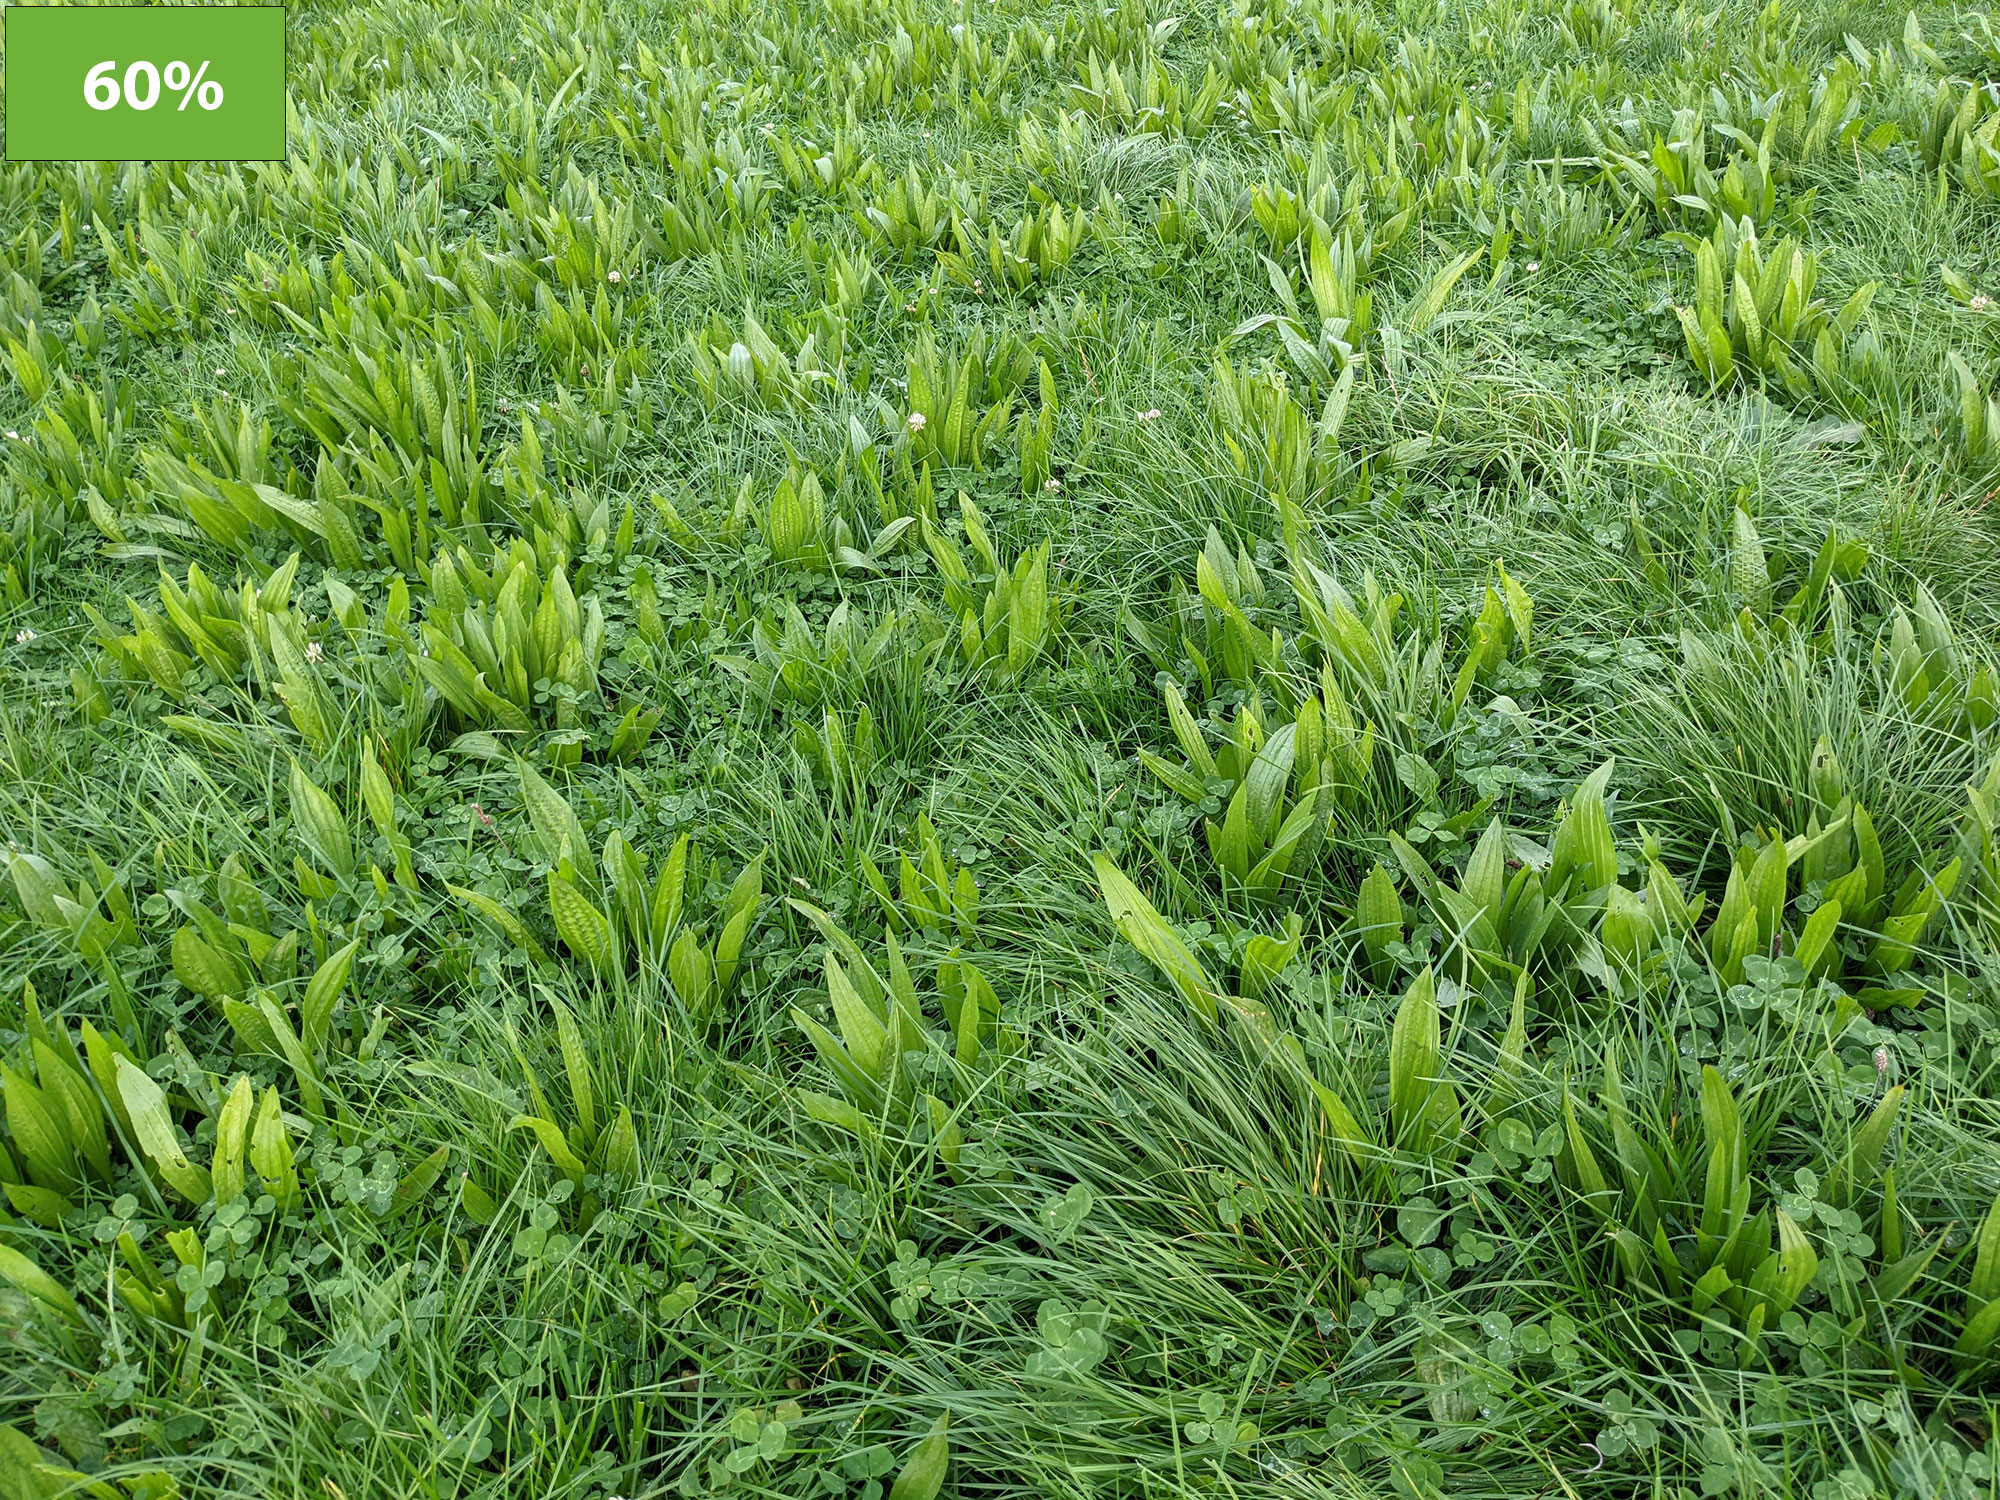
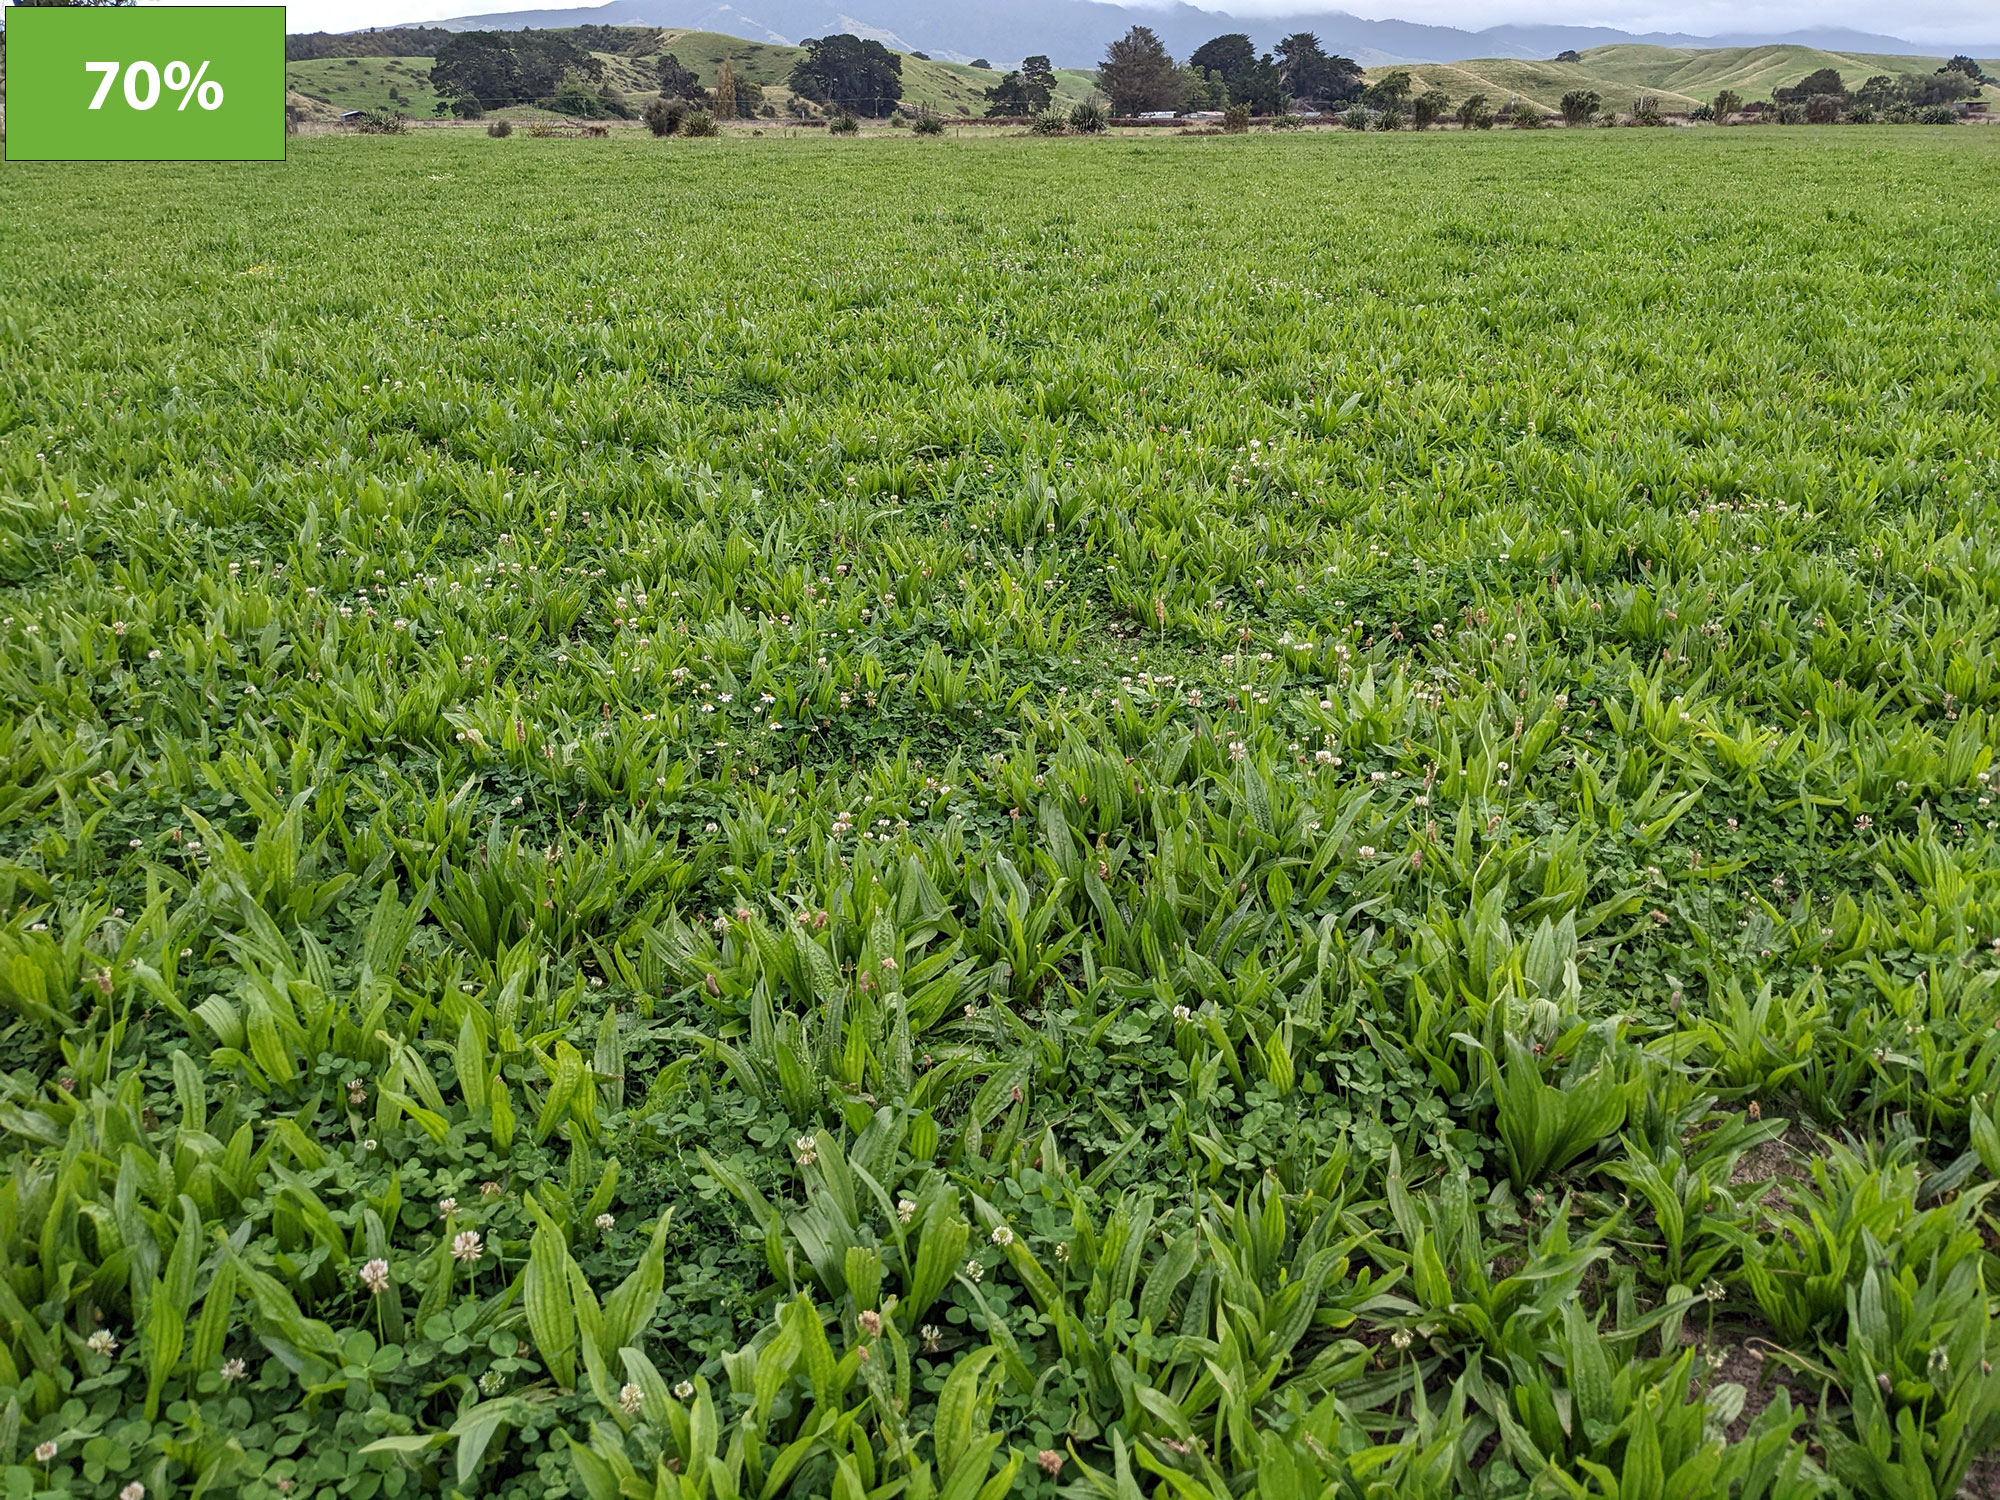
Our visual assessment method can be used to estimate the proportion of plantain in the pastures. The method has been tested across New Zealand and has been shown to be accurate against pasture composition cuts to within a 10% confidence interval. Get a feel for what each plantain percentage looks like using the galleries below.


In the example below, average plantain content is 506.5/20.6 = 24.6%
| Paddocks | A) Area (ha) | B) Plantain content (%) | C) A x B |
| Red paddock | 3.5 | 5% | 17.5 |
| Blue paddock | 4.1 | 25% | 102.5 |
| Green paddock | 3.3 | 20% | 66 |
| Purple paddock | 5.2 | 40% | 208 |
| Yellow paddock | 4.5 | 25% | 112.5 |
| Total | 20.6 (D) | (E) 506.5 |
Now’s the perfect time to check in, plan, and set up for a strong season. We’ve pulled together smart tips and tools to help you stay ahead all winter long.
Whether you prefer to read, listen, or download handy guides, we’ve got you covered with trusted tools to support your journey every step of the way.
Put our proven strategies and seasonal tools to work. Boost production, support animal health and watch your profits hum.
Tools that are backed by science, shaped by farmers and made for this season.
That’s Summer Smarts.
Autumn Smarts brings together the research-backed tools that build resilience and boost performance.


