Forages for Reduced Nitrate Leaching, Parekarangi Trust
2 min read
Parekarangi Trust Farm in Rotorua operates both a dairy and a dry stock unit. This farm, overseen by manager Jason Perry, became a monitor farm for the FRNL project in 2016. On joining the project, Trust Chairman James Warbrick expressed the benefits of using hard data and science to guide them in managing different forages and adhering to new regulations. Their aim is to collaborate with scientists to address challenges concerning nitrogen and phosphorus losses. Historically, this land has been crucial for food production, and the goal is to continue this legacy while protecting the environment for future generations.
Parekarangi Trust Farm, Rotorua, straddles the Waikato and Bay of Plenty Regions and comprises a dairy and dry stock unit. The farm became a monitor farm in 2016.
Area:
369 ha effective milking platform
Dominant soil:
Haparangi silt loam
Average rainfall:
1600 mm
Crops grown on the milking platform:
kale, fodder beet, summer turnips
Supplements fed:
pasture silage, PKE and dried distillers grain
Cow numbers:
1098-1143, peak milked 1030 -1058
Production:
342,397- 400,797 kg MS. 928 -1086 kg MS/ha, 331- 379 kg MS/cow
Support block:
314 ha for dairy support, sheep and beef production
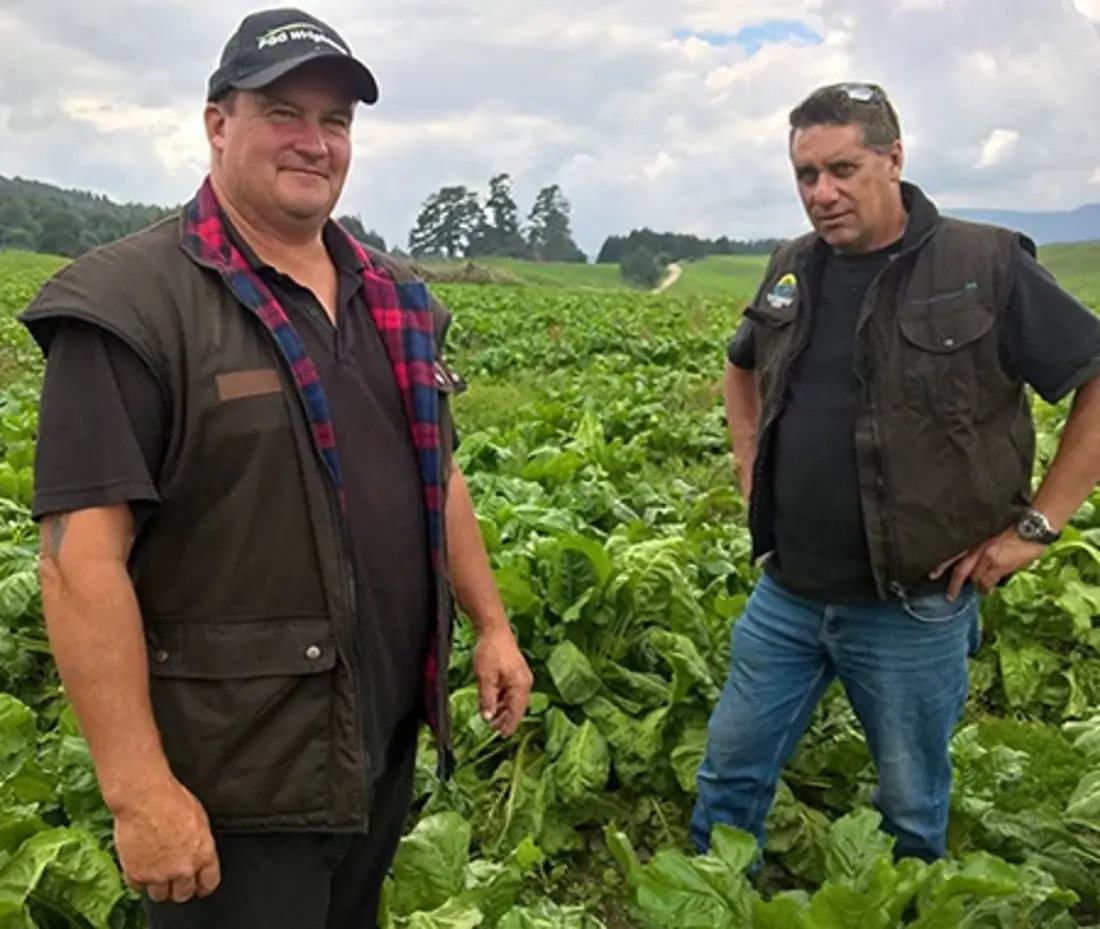
The dairy unit, managed by Jason Perry, became a monitor farm for the FRNL project in 2016. Trust Chairman, James Warbrick, has commented on joining the project.

Jason Perry and James Warbrick.
We have hard data from previous projects that is helping show us where we are positioned. The science is helping guide us on the use of different forages like fodder beet, and different ways of managing the land. This way we can meet the new regulations while also preserving the environment we farm in.

Like other farms in the Rotorua catchment, we are facing new regulations and targets we need to meet. We think the science done on our farm will help us meet those challenges. We want to be active in working with the scientists to find solutions around nitrogen and phosphorus losses, rather than sitting around and waiting for others to figure it out.
Historically the land has been a food bowl providing for our iwi, from growing kumara pre-Europeans, to producing food from sheep and cows. We need to take a long-term view about how we can maintain that while being strong guardians of the land for future generations.
As farmers, if we have the right tools to take care of the land and water, we are making sure we have a future where we can feed and provide jobs for our people. That’s a win-win.

2016/17 - Using fodder beet for autumn grazing
The 2016/17 season was challenging due to extremely high rainfall (2769 mm), approximately 1000 mm more rainfall than average. These wet conditions led to changes to normal feeding regimes, with damage to pasture from grazing and difficulty getting on paddocks to feed supplements at times.
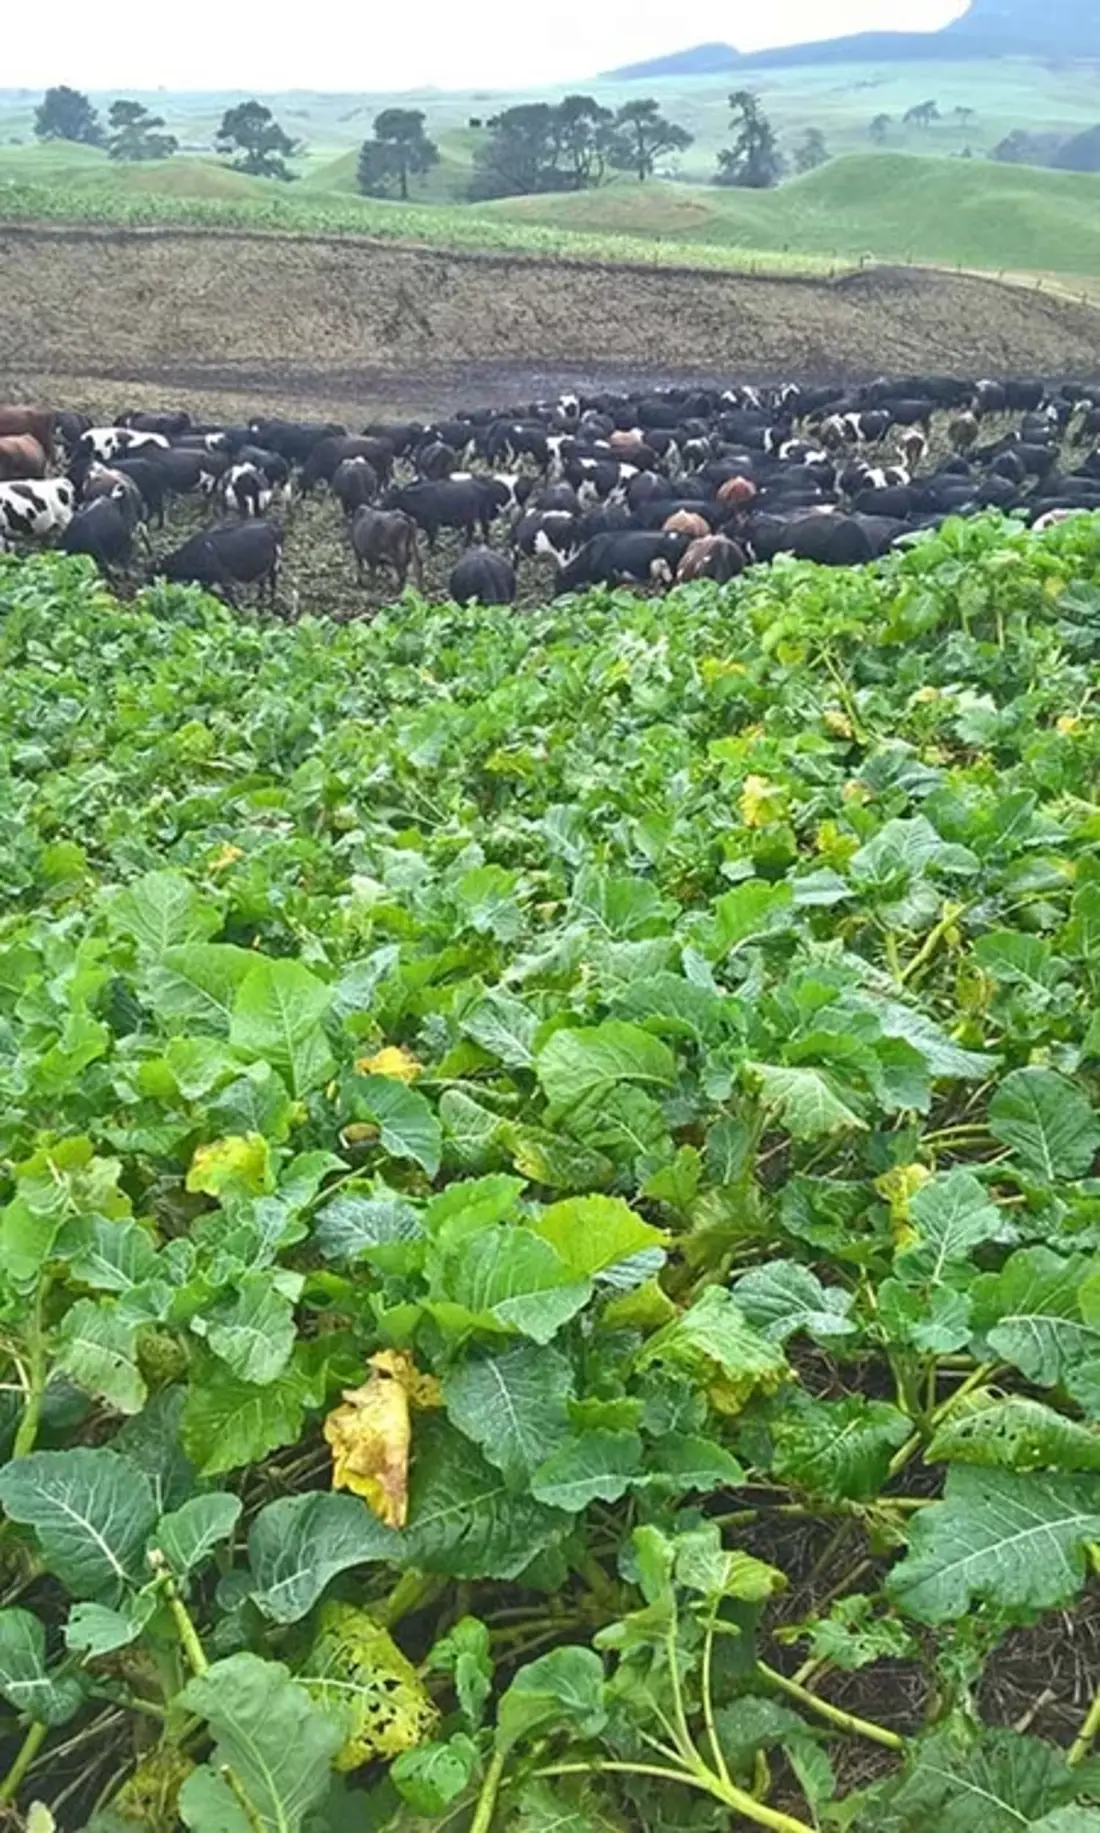
Kale was grown on the milking platform to supply autumn feed
Milk production was lower than the previous season. Kale (10.2 ha) was grown on the platform for late lactation feed. A 3-ha paddock of fodder beet was trialled, achieving good yields (17 t DM/ha) and feed quality, with low crude protein but with a high establishment cost.
This was grazed in April/May. Summer turnips (18.9 ha, 11 t DM/ha) were grazed in February to mid-March. Palm kernel expeller (PKE), sometimes blended with corn dried distillers grain was fed throughout the lactation, and pasture silage between January and August.
2017/18 - Introducing catch crop
The 2017/18 season rainfall was not as extreme as the previous year, but heavy rainfall events still caused challenges at times, affecting the establishment of the oats catch crop. The area of fodder beet grown on the milking platform was expanded and used in late lactation, with higher yields than the previous season (21.7 t DM/ha).
Oats were sown after the fodder beet and were grazed in spring. Summer turnips (13.5 ha) grazed from mid-January to late February had poor establishment and low yields (7.8 t DM/ha) compared to previous years.
Oats catch crop following summer-grazed turnips.
Milk production was higher than in 2016/17 as a result of increased supplementary feeding, higher peak cow numbers and more fodder beet contributing to higher milksolids yields in late lactation. These changes, along with increased nitrogen fertiliser use led to a 17% higher N leaching loss for this season when compared with 2016/17.
2018/19 - Drying-off early instead of feeding fodder beet in autumn
The 2018/19 season was challenging due to low rainfall over summer and autumn. Summer turnips (18.1 ha at 17 t DM/ha) fed from late January to the end of February were grown on the milking platform to improve summer feed supply and quality.
Turnips grown in 2019 on Parekarangi.
Paddocks were then sown to oats for winter feed or into new pasture. No fodder beet was grown on the milking platform due to difficulties of winter establishment of oats and pasture following the fodder beet in previous years. Reducing reliance on crops such as fodder beet and high inputs of supplements to extend the lactation and instead drying cows off earlier led to lower nitrate leaching estimates on the milking platform.
The lower N leaching also corresponds with the lower N fertiliser use, higher N use efficiency, lower N surplus, and low milk urea N concentrations for the season. However, as Parekarangi also contains a dry-stock unit where cows are wintered, the impact of leaching on this additional land when transferring dry cows earlier must also be considered.
| Farm details | 2016/17 | 2017/18 | 2018/19 | Source, comments |
| Cows and farm size | ||||
| Herd size (1st July) | 1143 | 1098 | 1000 | Actual |
| Peak cows milked | 1030 | 1058 | 1031 | Actual |
| Farm size (effective ha) | 369 | 369 | 369 | Actual |
| Stocking rate (cows/ha) | 2.8 | 2.9 | 2.8 | Peak cows/eff. ha |
| Liveweight (kg) | 446 | 4461 | 4461 | Actual |
| Feeding | ||||
| Pasture offered (t DM/ha) | 11.9 | 11.5 | 11.9 | Farmax |
| Pasture offered (t DM/cow) | 4.2 | 4 | 3.8 | Farmax |
| Supplements offered (t/cow) | 1.1 | 1.2 | 1.1 | Farmax |
| Off-farm grazing (t/cow) | 0.4 | 0.5 | 0.8 | Farmax |
| Supplement offered (t/ha) | 3.3 | 3.6 | 3.3 | Actual |
| Supplements + off-farm grazing/feed offered (%) | 26 | 30 | 33 | Farmax |
| Purchased feed/feed offered (%) | 10 | 18 | 17 | Farmax |
| Production | ||||
| kg MS to factory | 342,397 | 400,797 | 367,310 | Actual |
| kg MS/ha | 928 | 1086 | 995 | Actual |
| kg MS/cow (peak cows milked) | 331 | 379 | 356 | Actual |
| Nitrogen | ||||
| Fertiliser N applied (kg N/ha) | 155 | 197 | 142 | Actual |
| Surplus of purchased N (kg N/ha) | 140 | 205 | 129 | Calculated2 |
| Purchased N use efficiency (%) | 32 | 26 | 34 | Calculated3 |
| N leaching (kg N/ha) | 61 | 71 | 55 | OverseerSci v6.3.24 |
| N surplus (kg N/ha) Overseer | 210 | 280 | 208 | OverseerSci v6.3.24 |
| N use efficiency (%) Overseer | 24% | 20% | 24% | OverseerSci v6.3.24 |
1 Used 2016/17 data, as only heifers weighed in subsequent years.
2 Fertiliser N + fed imported supplement N - product N (milk and meat).
3 100 × product N ÷ (fertiliser + fed imported supplement N).
4 Overseer includes estimates of N inputs from biological fixation, rainfall and irrigation.
As a result of learnings from this programme:

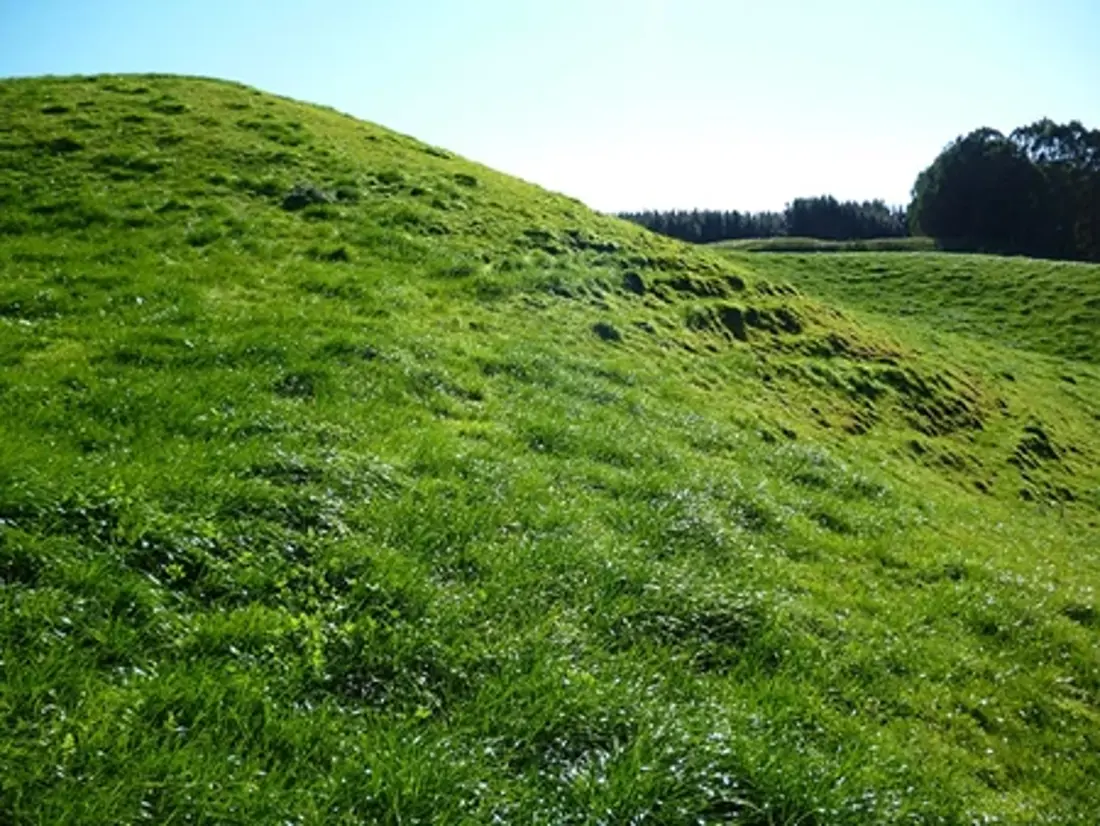
New pasture establishing after turnips, May 2019
Now’s the perfect time to check in, plan, and set up for a strong season. We’ve pulled together smart tips and tools to help you stay ahead all winter long.
Whether you prefer to read, listen, or download handy guides, we’ve got you covered with trusted tools to support your journey every step of the way.
Put our proven strategies and seasonal tools to work. Boost production, support animal health and watch your profits hum.
Tools that are backed by science, shaped by farmers and made for this season.
That’s Summer Smarts.
Autumn Smarts brings together the research-backed tools that build resilience and boost performance.