logo

Budgeting, Pete Morgan and Ann Bouma (South West Waikato)

Topics

26 min read

Farm facts Numbers at a glance Mid-season update Management decisions 2023-24 forecast budget Previous season reviews Additional resources

This 230 ha, owner operated farm, situated in Pokuru, Waipa, is fully self-contained with 510 cows peak milked and all young stock kept on farm. A more conservative approach with the utilisation of resources will reduce the financial and environmental risks and provide a more resilient business and better environmental outcomes. Being early adopters of technology has enabled efficient use of all resources and is key to ensuring environmental targets are measured and met. All farm systems decisions are research and evidence-based.

Farming using the Halter technology continues to add interest and enjoyment to farming for the owners and the staff on this South West Waikato farm.

Pete Morgan and Ann Bouma have spent considerable time researching and modelling the move to being a fully self-contained system with yearlings and weaners at home. This is being implemented for the 2023-24 season.

This change has in part been driven by a changing attitude to risk over the past decade and the development of a more conservative approach to the utilisation of resources – people, time, land, machinery and finances.

A more conservative approach reduces financial risk from exposure to inflation, and is an insurance against variability of supply. It also improves the ability to manage environmental extremes and limit the adverse effects on pasture and livestock.

The move to being fully self-contained will decrease labour requirements and greenhouse gas emissions for the business as there will be fewer cows and fewer young stock required.

Ripairian planting

1 / 6 images

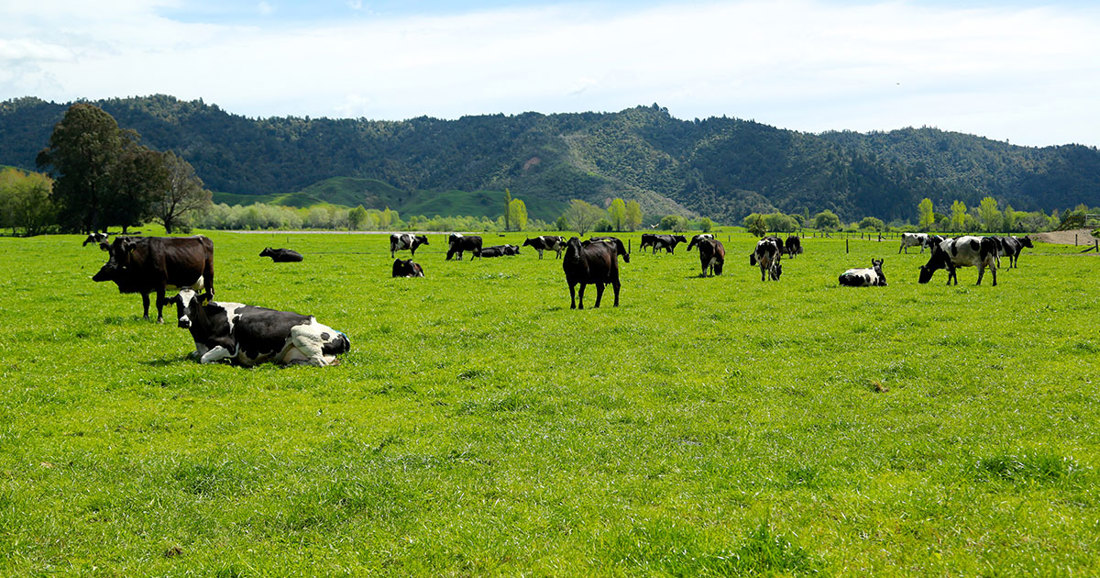
Cows on break with Causmag.

2 / 6 images

Cows on break with no fence.

3 / 6 images

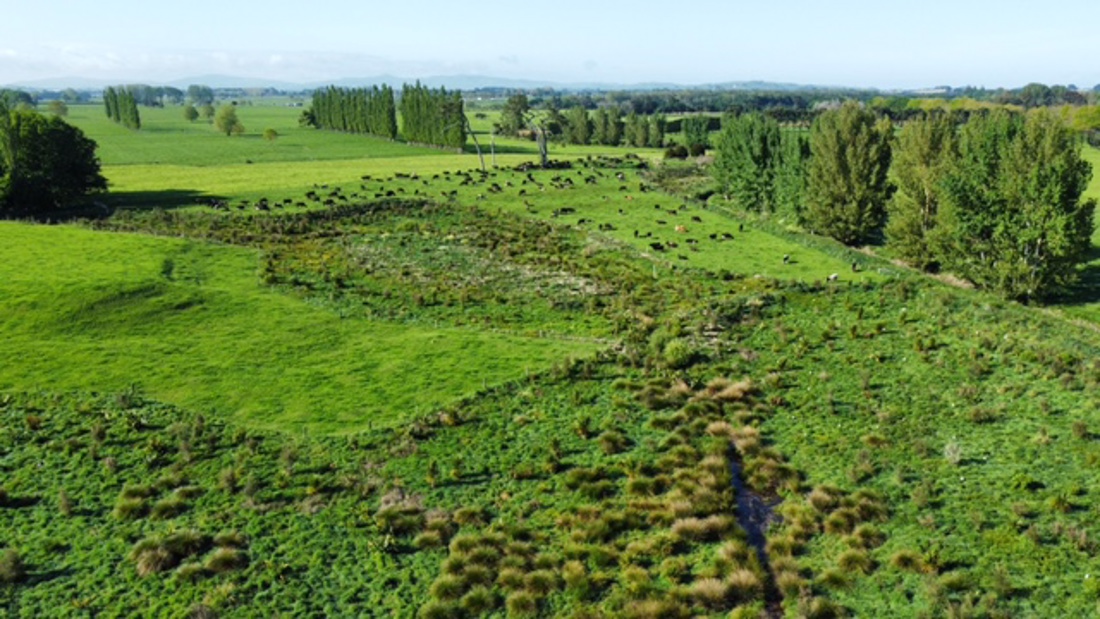
Low-lying wet areas fenced and planted.

4 / 6 images

Riparian planting.

5 / 6 images

Riparian planting.

6 / 6 images

Farm facts

Business type:

Owner-operator

Location:

Pokuru, Waipa

Farm size:

230ha effective milking platform, no support block

Peak cows:

510 FJX (520 wintered), 100 yearlings wintered

PSC:

18/7/2022 MA cows (15/7/2022 Heifers)

Stocking rate:

2.6 cows/ha including all young stock

Farm system:

2 (1-10% feed imported)

Production:

194,100kg MS/year budgeted, 844kg MS/ha 381kg MS/cow

Production (last 3 years):

355 kg MS/cow and 937 kg MS/ha average

Numbers at a glance

Financial KPI 2023-24 budget
Net dairy cash
income ($/kgMS)
Total farm working 
expenses ($/kgMS)
Total operating
expenses ($/kgMS)
Dairy operating profit ($/ha)
$8.40 $5.10 $5.76 $2,283
Physical KPI 2022-23 est
Pasture and crop
harvested (t DM/ha)
Purchased N
surplus (kg N/ha/yr)
GHG (t CO2 
equiv/ha/yr)
Six week
in-calf rate (%)
12.6 6 7.6 63

Find out more about these KPI's and how to calculate them for your own farm here.

2023-24 mid-season update January 5th 2024

Numbers at a glance

2023-24 mid-season update as of 5th January 2024.

View/download PDF of updated budget

Financial KPI's Budget Updated forecast
Milk Production (kgMS/ha) 844 803
Milk Production (kgMS/cow) 381 355
Net Dairy Cash Income ($/kgMS) $8.40 $9.40
Total Farm Working Expenses ($/kgMS) $5.10 $5.53
Cash Operating Surplus/Deficit ($/kgMS) $3.30 $3.87
Gross Farm Revenue ($/kgMS) $8.47 $8.37
Operating Expenses ($/kgMS) $5.76 $6.25
Operating Profit ($/ha) $2,283 $2,500


Comments and points of interest

Key points 

•    Milksolids to the end of December is 2% up on budget, with peak cows milked up 2%.
•    Although unplanned, capital expenditure to upgrade the dairy sheds and plant has improved efficiencies for milking, stock handling and weighing.
•    Savings in costs of supplements made, regrassing, cropping and fertiliser have more than offset increases in R & M.
•    Conservative budgeting for milk price plus and increase in forecast stock income means income is tracking about 6% up on budget.
•    Farm working expenses and dairy operating expense are currently tracking 4% up on budget.
•    Operating profit should be on budget or up slightly.

Comments

Milk production to 31st December is 130,580 kgMS, 2% up on the 127,000 originally budgeted. Peak cows milked is 520 which is 2% up on budget, (10 more cows). 
The herd peaked at 2.0 kgDM/cow/day in late September. The previous season daily peak per cows was 1.85 kg MS/c/day. This is a very satisfactory performance considering the herd this year consists of about 28% first calvers.
Supplements fed to date are 54 t DM PKE, 30 tDM pit silage, 50 tDM maize and 5 tDM of hay, which equates to about 270 kgDM/cow or 600 kgDM/ha. This is more than double to the same time last season although some of this total has been fed to the 104 yearlings carried on farm.  
The PKE has been fed at rates of 1.0-1.5 kgDM/c/d to deliver minerals at rates that will supplement the minerals in the water supply.  This enables levels in the water supply to be kept lower so palatability is not impacted. 
Pasture growth rates have been good on average but there has been some wide variation particularly in October and December when there were a couple of prolonged drier periods. The main challenges with pasture management have been making good strategic decisions on rotation length this season. We have not managed to control 10% of the farm pasture well and while the 2 dry periods so far this season have pushed the seed heads rapidly, our lack of experience in blending young mobs with the herd grazing decisions has contributed. Some good learning in it for us all.
To date 29 ha, (108 tDM), have been harvested for pit silage and baleage and 3.8 ha, (6.75 tDM), of hay has just been made. This is about half of what was in the budget. 
The opportunity arose to purchase 18.7 t DM of hay. It was good quality, a good price, ($700/tDM compared with $760/tDm), and locally grown, so transport costs were low. This 8.7 t DM more than budgeted, but the extra feed will provide additional feed security for next spring as part of a more conservative approach to management.
Nitrogen use is similar to last season with only 25 kg N/ha being applied to date. Nitrogen, (and fertiliser), applications continue to be much more targeted, using information on pasture cover and growth rates from Halter. All nitrogen has been applied with own equipment which has allowed for better timing and placement of applications.  All nitrogen applied is as SustaiN or DAP at 23 kg N/ha.
To work around an unplanned absence from the farm in October, (Pete), the cropping programme was revised. Instead of planting 20 ha of chicory, 9 ha of turnips and 7.4 ha of Maize, only 12 ha was undersown with plantain and 10 ha of maize was planted. In addition, about half a ha was undersown with left over chicory seed from last year, and there is 2 ha of last year’s chicory crop that was not sprayed out when regrassed which is growing well.
This has significantly reduced cropping and regrassing and weed and pest costs even with more spent on the maize.
It also has meant that more of the farm is in permanent pasture going into the summer and less will be out of rotation in the autumn for regrassing.
The maize was planted 8th November and growth rates have been a bit behind usual due to cooler and cloudier weather to date.
The updated budget is currently being worked on 185,600 kgMS for the season, (184,600 kg to the end of April, payment received in May), which is erring on the side of caution. This milksolids is actually about 4.3% down on the original budget of 194,100. The spectre of El Nino is large and a long dry summer/autumn is still possible hence the conservative forecast for the seasons milksolids.     
Milk income is still looking to be up about $99,000, (6.5%), as the original budget was based on a milk price of $6.05/kgMS and dividend payments of $0.20 /share. It has now been updated to $6.10 advance milk price and $ 0.55/share. The deferred payment was $30,000 up on budget as well.
Total farm working expenses and operating expenses are on track to be up slightly on budget, but on less milksolids could be up $0.40-$0.45/kgMS or 9%.
Repairs and maintenance costs are up over 200% largely due to additional work needing to be done in addition to the capital expenditure for the dairy shed upgrades. This includes replacement milk lift pump and old front gates and upgrades to the roof and guttering of the second shed.
Feed made, regrassing and fertiliser costs are well down and more than offset the increase in R & M costs.

Current situation

Pasture cover as at 5th January 2024 is 2,350 kg DM/ha. Current growth rates are 62 kgDM/ha/day, (as per Halter pasture pro) and rotation length is 31 days. This is longer than usual for this time of year.  
A conservative approach was adopted in December, to lengthen the round and try to protect pasture cover earlier than usual when soil conditions were becoming dry and growth rates were dropping. Rainfall between Christmas and New Year meant that with hindsight 31 days was probably a bit long, and now pasture quality is a bit lower as a result.
However, the farm is well set up going into the middle of summer with higher cover than usual and already on a longer round.
There are 515 cows currently in milk, 255 younger and lighter cows with lower SCC that have been on once a day milking since mid-December and 249 older cows on twice a day. A “resting mob” of 11 cows has been maintained all year with cows moving in and out as needed. 
Daily per cow production is1.2 kg/cow/day, (average for all herds). This is 14% down on the daily per cow production for the same time last year and is a reflection of the lower pasture quality from being on a longer round, as well as the higher percentage of first calvers in the herd.
The whole herd was weighed and condition scored mid-December. The herd average was 435 kg liveweight, with the first calvers at 395 kg and second calvers at 412 kg. The latter had suffered growth checks as calves and had pre calving liveweights that were 26 kg lighter than the current crop of first calvers. This liveweight and BCS information was used split the herds in mid-December.
The cows are currently being fed about 17kgDM/cow/day made up of pasture and 0.4kgDM/c/d of PKE with zinc supplementation just started. Zinc through the water supply will start soon, particularly if the current high humidity continues.
There are 100 weaners on farm and 104 rising 2 year olds, (R2’s). Their grazing management has been simple with the R2s, (all with Halter collars), moved daily and the weaners behind a fence and getting 1-3 day breaks. 
Since all the R2’s are collared, we are experimenting with 11 R2’s running with our young cow mob. The feeding level and access to PKE at the shed should give them an advantage and we will test the assumption on their next weighing. They are all very well handled now and quiet and we are looking to build on this by rotating all the R2s through the milking mob to train them to the shed for next season as well as the PKE and daily routines under Halter.
One part time staff member is responsible for all young stock work. The animals are weighed regularly which gives the opportunity to rotate any lighter weight animals in to a second preferentially fed mob. All young stock are looking good and as at January 7th the weaners averaged 142 kg liveweight and the R2’s averaged 367 kg which is above target so a very pleasing result.

Looking forward

Reasonable rainfall at the end of December means soil moisture levels are OK for this time of year. The farm has light soil types which dry out very quickly so the situation could change suddenly with the return of some hot, sunny weather.
Feed budgeting remains a priority and all decisions from now on will be a balancing act of managing feed supply and demand to ensure end of season targets for cow condition and pasture cover are met so that next season is not impacted. 
Silage, baleage and hay on hand at present equate 194.5 t DM. There is also about 160-170 tDM of maize silage to harvest mid-March and 33.3 tDM of PKE still on contract. Of this about 80-90 t DM will be carried over for next season so this leaves about 300-310 t DM available for the summer and autumn or 600 kgDM/cow.
Pregnancy testing is planned for mid-February, and once empty cows are identified a culling list can be made. If de-stocking is necessary the policy is to remove any cows that are not wanted for the next season regardless of production.
Culls have been booked in to the works early again. There are 50-60 cows scheduled to go between 15th February and 31st March.  Getting culls away early also means that higher cull prices are more likely as well as it frees up feed for the rest of the herd. 
Further culling will be done in stages from mid-March, depending on feed supply. Some of these will be as in A 2 in milk empties and some as empty carry over cows, (these will also be higher than cull price).

Calving and reproduction

•    The calving rates for this year were; 3 weeks, 64 %, 6 weeks, 85%, 9 Weeks, 96%. These are similar to last season, (62%, 82% and 99%). 
•    The 3 week submission rate for spring 2023 was 88%, which similar to last season, but give that 40 of the purchased A2 cows didn’t calve until September, this is a reasonable result.
•    The submission rate for the first calvers is 97% which is particularly pleasing given that their live weights were below target going into the winter.
•    Mating ended 22 December, with AB used the entire 11 weeks, (short gestation semen used on the last 2 weeks). 6 bulls were run with the 104 yearlings.
•    The early estimate is for a 6 week in calf rate of 69% which is up slightly on last year, (67%).

Other points of interest

•    Significant capital outlay to upgrade the sheds has helped to make stock work and weighing a lot easier.  The information from this means decision making is easier as it is based on fact.
•    The plant changes were all in the North shed. With the changes to our farming system and lower peak cow numbers, we can now milk all cows through this shed 80% of the time. 
•    The shed upgrades included rebuilding the plant wash system, a new milk lift pump, adding automatic cup removers and automatic teat spraying. 
•    The main benefits of investment and ability to enhance our use of Halter would come from making the North shed the most efficient. 
•    We also have plans to put auto drafting Protrack in there but have delayed as manual drafting, (“Bro-track”), is simple and can be done with the collar lights from Halter easily. 
•    The combined cost of drafting and the modifications to the yard, (>140k) was outside our current capex plans.
•    The changes to the North shed have enabled us to either remove one person from the shed or increase the amount done during milking, (tail trimming, drafting, lame cows etc…).
•     In addition, the cows are milking out well and getting thoroughly teat sprayed resulting in a vast improvement in teat condition. We had not realized how variable we were in our judgement of milking time even using Tmax.
•    Both sheds have had their vet/AB races modified to improve their ease of handling the regular weighing and managing of young stock along with AB and general cow work.
•    Information from Halter is continuing to improve decision making processes. The pasture management modelling has been upgraded to now model and predict responses to changing round length, stocking rate, feed intakes, nitrogen applied and supplements fed. The model is using growth rates predicted from local and actual farm data which provides much better output, and is not impacted by overcast days and cloud cover like some other systems.
•    It has allowed a better understanding of the feed situation at any one moment and the ability to better predict the feed ahead. 
•    Based on this improved modelling the decision was made to drop other formal forms of pasture cover assessment. 
•    Rumination data was used again this season to aid with decisions about keeping cows in the colostrum mob. It has been more successful this year, (that is, less issue with cows going into the herd too soon). 
•    Springers and colostrum cows were fed more hay to increase their rumination. This has resulted in much reduced clinical metabolic issues during calving and transition. Numbers of animals and metabolic treatments used is similar to last year but we have been very liberal in treating preventatively any at risk animals (old, difficult calving, light BCS…). Losses to date are below 1%.

 Environment

•    This year the focus is on maintaining the riparian areas that were planted previously, particularly the 17,729 plants planted in the autumn and spring of 2023. This large number of plantings was only able to be done with support from two local industry bodies who helped willow removal, planting, and providing plants at a subsidised cost: Waipa Rerenoa Restoration Project is a Waikato River Authority funded project and Puniu River Care our local marae based river care group (https://puniuinc.org/)
•    There is a long maintenance list including preparing future planting areas. This can have a 2-3 year lead in. For example, controlling blackberry and moving fences out 5 m from waterways. 
•    We have committed to panting another 5,000 plants, (about 0.5 ha and 4,000 plants of new riparian area plus 1,000 bigger trees planted into existing riparian areas). 

Future Plans

We continue to be involved in industry projects including a field day on farm in the autumn as part of DairyNZ’s Step change project. This is a follow up on work done a year ago with modelling for the farm changing from a system 2 to a system 1 with all young stock home.
Another industry project is the Resilient Pastures project that was initiated in Northland by a group of farmers, industry bodies and scientists to collectively design a research and extension programme. It will address the declining pasture persistence and develop proven adoptable adaptation strategies for farmers to future proof pastoral farming across Aotearoa.
We will all be challenged to continue maintaining healthy pastures from the threats of climate extremes, pests, diseases and weeds as well as our own management, (overgrazing in summer). This project looks to build long term resilience through research, extension and collaboration.

Management decisions

Strategy and financial

  • Vision
    Operate a simple, evidence based, low cost, profitable and resilient business that enables the owners to enjoy a quality lifestyle with family and friends. Have a strategic plan that includes looking for opportunities to future proof the business.
  • Review budget regularly
    Review the budgets regularly to assess options and act early. This is at GST time or sooner if there is a significant change in the forecast payout, a severe weather event or a major breakdown.
  • Planning
    Review each season, (good record keeping is a must for this), and use that for planning the next one.  Carry out planning for next season early in the prior autumn. Use this plan to build the budget.
  • Debt
    Once the last of the major capital expenditure programmes have been completed the focus will return to retiring debt.
  • Communication
    Ensure all staff understand the farm plan and have regular, (usually weekly), team meetings to keep everyone updated.
  • Networking
    Utilise expertise from other professionals, in particular accountant and local farm consultants and specialists.
  • Benchmark
    Share information, seek out top performers in the area and learn from them as well as use benchmarking.
  • Technology and Science
    Keep up to date with current research and technology, evaluate and be early adopters of technology to enable efficient use of all resources to further aid in measuring and managing environmental emissions so targets can be met.
    Utilise Halter to fully achieve the gains this system can provide:reducing time and labour requirements on farm whilst increasing production outputs through more efficient pasture utilisation, better animal welfare and improved sustainability standards.
  • Environment 
    Achieving a high standard of environmental outcomes for the farm is a priority. The whole farm system is evidence driven with research science behind all decisions, many of which impact the key environmental KPI’s.

Farm policy and infrastructure

  • The farm operates as a system 2 production system with imported feed at approximately 3-4% of total feed eaten.  All young stock are on farm.
  • The whole farm system is evidence-driven, so research science is behind all decisions and achieving a high standard of environmental outcomes is an important part of implementing the farm plan.
  • The herd is now all A2 genetics. The cows are usually managed in 2 herds although Halter technology makes it easy to manage the herd in several mobs if need be.
  • There are 2 herringbone dairy sheds on the farm, one 34 bails and one 28 bails. The 28 bail shed has an in shed feeding system, and a feed pad nearby.
  • Both sheds will be in operation during calving with one used for colostrum cows and the other, (the 28 bail, in shed feeding), will be used for the milking herd. Once calving is finished the cows will all be milked through one shed.  The other shed will be used on occasions when the herd is grazing in proximity to that shed.
  • PKE at low levels, will be fed daily in shed to the milking herd as a means to deliver minerals when required, (Mg in the spring and Zn in the summer/autumn).
  • It is 1.5 km from the either farm dairy shed to the furthest paddock.
  • The average paddock size is 6 ha now that Halter technology is used and grazing areas can easily be determined by mob size and pasture cover. Electric fencing is still required for grazing management with the weaners.
  • All cows and in-calf heifers are wintered on the milking area with predominantly all grass feeding.
  • Yearlings and weaners will general be grazed at one end of the farm, furthest away from the main milking shed, but there could be some cross over with the milking herd herd.
  • Focus is on getting the basics right. The correct calving date, stocking rate and pasture management leads to good pasture utilisation.
  • Light soil types mean the farm is susceptible to summer dry. Once a day milking is used for the whole herd early in the season. Depending on cow condition and feed supply this is usually mid to late December, but can be as early as November or as late as January.
  • Drying off decisions are made on cow condition, feed budgets and calving dates, (not production), to ensure pre-calving target CS of 5.0 for MA cows and 5.5 for 2 year old heifers are met.
  • Success depends on knowing the correct target pasture covers for the farm at critical times, (start of calving, mid spring when growth exceeds demand and start of winter), and the use of feed budgeting to ensure these are achieved.

Feed

  • Pasture
    Aim to optimise the amount of pasture grown through good pasture management which includes achieving optimal soil fertility, strategic use of nitrogen, minimising pasture damage in the winter and overgrazing in the summer, and have a planned approach to pasture renovation.
    Pasture cover and growth rates are monitored at least every 2 weeks and this information is used along with the spring rotation planner to manage pasture allocation during the spring. Frequent monitoring of feed budgets allows for proactive and early decision making.
    The herds are checked during the day to monitor grazing residuals and may be shifted more than once if necessary. Halter technology makes it easy to shift stock, so it is easy to achieve target post grazing residuals all the time now. Better allocation of feed during the winter and spring has also reduced pasture damage and increased pasture utilisation.
  • Feed policy
    The feed policy is developed around a conservative approach to feed supply in recognition of the more variable and extreme weather events that are now being seen. About 110-120 kg DM per cow of supplement, (maize or pasture silage plus a little bit of hay), will usually be carried through from the previous season for use in the spring.
    The feed carried into the winter for the 2023-24 season is close to 190 kg/cow. This is partly because less supplement was needed the previous autumn, but also, this is the first winter where all young stock are on farm so having extra feed provides a more security as systems for being self-contained are embedded.
    The ongoing challenge of managing low growth rates through the summer dry period means the budget could extend to purchasing additional PKE, but is price dependent. The decision is always made based on feed budgets, feed prices and the milk price.
  • Cropping
    7-8 ha of maize is grown as part of pasture renovation and for weed control as well as to provide a bulk of feed later in the season, and for the following spring. To minimise the impact of cultivation on the light soils the maize is direct drilled with strip tillage practices. The budgeted yield is 18 t DM/ha.
    9 ha of turnips, are planted for weed control and to transfer feed from December to February. Plantings are staggered so the crop is not all ready at once.
    20 ha of chicory are planted for summer feed. This will largely be used for the yearlings and weaners.
    The turnips and chicory are planted using the farms own air seeder, which gives more flexibility around planting times along with precision seed placement and allocation.
  • Supplements made
    Surplus pasture is made in to silage or hay. The amount can vary each year but the budget is for 60 ha at a 2 t DM/ha yield. This is used to fill summer deficits.
  • Supplements purchased
    A small amount of hay, (about 10 t DM), is purchased each year to be used in the winter and spring during wet weather to help settle dry stock so trampling damage is limited.

Herd

  • The animal health focus is on good observation, prevention and early treatment if required. Information from the Halter technology plays a big role in this, as it highlights any animals whose behaviour has changed.
  • Best practice is followed to ensure good udder health and good quality milk is produced. SCC are 125,000-130,000.
  • The breeding policy is formulated with the aim of achieving a compact calving of 12 -14 days to mid-point for a planned start calving of July 18th for cows and July 15th for heifers.
    Pre-mating heats, (identified from Halter information), are used to identify cows for anoestrous and synchrony treatment. The 2 year old heifers are usually put on once a day milking from 1 month before mating, and fed additional supplements if feed is short, to ensure better mating outcomes for this age group.
  • The yearlings are fitted with Halter collars and will also be mated to AB.
  • Mating is for 11 weeks using all AB. This is made up of 3 weeks AB plus 2 days to cover returns from cows treated for anoestrus, with the top 20% of the herd on genetic merit mated with sexed semen, the lowest 20% mated to AB short gestation, (SG), Hereford semen and the rest of the herd is mated with premier sires. AB will continue for a further 5-6 weeks using SG Hereford semen. The last 2 weeks of mating is with AB using short gestation bull semen. With the use of SG semen the actual calving period is about 9 1/2. The aim is to be finished calving by September 20th. All dairy semen used is A2 genetics.
  • The replacement rate is 18-20%. Systems are in place to ensure 100 kg live weights at weaning for replacements, (crossbreds), are achieved.
    Young stock liveweights are monitored, and measured against industry recommended liveweight targets. Action is taken early if the liveweight gains are not on target.
  • Young stock with be run in mobs of about 50 animals each as research shows this is an optimal number for animal welfare. During the summer the plan is to graze them on chicory and feed PKE.
  • The herd undergoes milk testing 4 times a year, (drought permitting), with once a day herd testing. This information assists with decision making for mating, culling, and milk quality control and drying off.
  • Colostrum cows are milked once a day. Rumination data supplied by Halter will be used to judge when they are up to speed enough to go to the twice a day herd, but it will not be earlier than 8 withheld milkings.

People, health and safety

  • Staffing levels are set that allow flexible work rosters that provide the owners and staff with better work/life balance.
  • One full time farm manager, one full time assistant manager and one full time farm assistant and 0.6 FTE of part time and relief staff are employed. The farm owners provide 0.4 FTE of unpaid input.
  • Remuneration levels recognise the experience and responsibility levels of each staff member.
  • Good documentation is provided for occupational health and safety and training is undertaken to ensure staff follow protocols and processes.
  • Halter technology has changed work routines and resulted in much improved work efficiencies. At the peak of the season staff hours worked is under 45 hours per week.

Environment

  • Soils and testing
    The farm soil type is predominantly Maeroa ash which is a well-drained allophanic soil. Protecting soil structure and maintaining weed free pastures are key considerations when implementing the farming system and do impact the budget.
    Individual paddock testing has been done in the past so this information is used to enable strategic fertiliser applications. Olsen P levels are 27 and pH is 5.9.
  • Nitrogen
    The policy relating to N use is
    • need to be sure of a good response
    • need to be able to utilise the feed effectively                                                         
      Realistically the opportunities that meet the above criteria for N use are limited, so N applications have historically been no more than 60 kg N per ha. Attention is paid to application rates, timing of the application and the type of N used so that the risk of N leaching is minimised.
  • Farm environment plan
    The FEP was completed in 2020 and is used to prioritise planning to ensure continued progress is made towards achieving the best environmental outcomes for the farm and business.
  • Riparian planting
    The farm plan includes continued focus on improving riparian areas. The farm now has over 21 ha of fenced riparian areas including over 1 km of river boundaries.
  • Effluent
    The current effluent irrigation area is 75 ha. Work is ongoing to increase this area as time and budget allow.
  • Halter
    The use of virtual fencing via Halter is one of the features of the programme. This enables fertility transfer to be controlled by excluding cows from camping areas which will reduce leaching and in the long term also fertiliser use.
    All virtual fencing of breaks are considered for their impact on soil and water. Steep slopes and sensitive areas are grazed for the minimum time necessary and avoided if conditions are not optimal.

Strategies for managing a dry summer

October 24th, 2023

How has the season been so far?

  • The 2023 -24 season has been pretty good so far. June was very wet but a drier July and August made the early spring a lot easier to manage.
  • Early season budgeting for production was conservative as this is the first season with 70 less cows and all the young stock on farm. Factored in to the budget was the fact the herd also has a higher proportion of first calvers this season and a slower than usual calving pattern due to the new A2 cows purchased having a spread calving.
  • So, a conservative budget, a reasonable spring and good planning has resulted in milksolids to date being 3000 kg ahead of budget which is pleasing.
  • Peak cows milked is 520 which is 10 more than budgeted as wastage has been low.
  • The cows have peaked at 2.2 kgMS/cow/day which is better than last season and above budget. The heifers this year are milking really well, as a result of targeted higher feed intakes over the winter. This has contributed to the higher daily per cow peak.
  • Unlike some years once a day milking has not been used prior to mating this season. Mating has been going for 2 weeks and the cows are cycling well.
  • The herd is still being fed 1 kgDM/cow/day of PKE through the shed as a vehicle for delivering minerals.
  • PKE used to date is 10.8 t from inventory and 20 t from the 100 t contracted for this year. The PKE was contracted early and the price is close to $500/t landed.
  • Pasture cover is 2350 kgDM/ha which is on target for this time of year.
  • There are 20 ha of silage shut already and another 10 ha will be dropped out of the next round. This will give 30 ha of silage which is about half of what was budgeted, but there are few more cows on farm.
  • Nitrogen use to date is only 12 kg N/ha, down on budget, in part because there has been sufficient feed.
  • The cropping plan has changed from the original budget mainly due to the owner needing to be away when much of the cultivation for the chicory and turnips would have been done. Instead of 7.4 ha of maize, 20 ha of chicory and 9 ha of turnips there is now 10 ha of maize, 25 ha over sown with plantain and 2 ha of chicory, (only planted as there was seed on hand from the previous year). There will be no turnips.
  • One paddock of last year’s chicory was just under sown with pasture last autumn rather than spraying it out before drilling. This is doing really well and still has a good proportion of chicory in the sward, so will help to augment the other summer crops.
  • Soil moisture levels are currently very good for this time of year with little but frequent rainfall. With the soil types being predominantly light and free draining they are very susceptible to dry spells and hot winds, so moisture levels can change very quickly.

What are cash flow forecasts looking like? How will a drought impact this?

  • With the early season production up on budget and the advance pay out similar to forecast the cash flow is currently on track.
  • The change in the cropping programme has decreased the cropping costs as there is less cultivation work and weed control needed.
  • There has been some unplanned capital and R and M expenditure. The milking plant in the main dairy shed needs to be upgraded as the milk lift pump and wash down system are not up to standard. The decision has been made to install automatic cup removers and automatic teat spraying system at the same time. Eventually a drafting gate system that is integrated with Halter will also be installed. This will make the shed a one person shed so labour savings will be significant.
  • If there is a very severe and prolonged drought milk production will be down and feed costs will probably have to go up so the operating profit for the season will drop. There is sufficient surplus in the budget to cope with this.
  • About one third of the cost will be repairs and maintenance, so the budget for R and M will be about double now. The balance will be capital expenditure.

Has the NIWA El Nino forecast changed how you are approaching this summer?

NIWA’s El Nino forecast has not changed our summer management plans as dry summer conditions are always factored into the farm plan and budget.

What strategies do you have this season for when a drought comes early, late, or is prolonged?

  • Changing milking frequency, extending rotation length, reducing stocking rate through culling and strategic drying off stock are all strategies used to help balance feed demand and supply to reduce pressure on pastures and livestock. The timing of this depends on when the summer dry occurs and how long it lasts. It has been as early as November in the past.
  • Culls are always booked in for early February once empties are confirmed. Close monitoring and matching of feed supply with demand happens all the time with the aim of being able to make decisions early.
  • At this stage the plan is to manage the summer with the current feed already budgeted for the farm – 30 ha silage, 37 ha of crops and about 80 t of contracted PKE still to use.
  • It will be critical to ensure that the young stock are well fed over the summer. At this stage the yearlings will be predominantly on pasture and the weaners with get crop and pasture.
    If there is a drought, and, it is particularly severe, or long, then more PKE will be purchased if absolutely necessary so that young stock liveweights and welfare are not compromised.
    However the season unfolds, management decisions made will ensure pastures are protected from overgrazing, young stock liveweights remain on target and cow condition and pasture cover for next season are not compromised.

2023-24 Forecast budget

Budget last updated April 2023

INCOME $TOTAL $/KgMS $/COW $/HA
Net Milk Sales
Milk income is based on 194,100 kgMS at and advance rate of $6.05/kgMS, (including a premium for supplying all A2 milk), and 220,000 kgMS at a deferred rate of $1.40/kgMS, (working on a final milk price for 2022-23 of $8.20/kgMS). The Fonterra dividend is estimated at $0.20/share on 237000 shares. The Fonterra capital dividend estiamted at $0.50/share is excluded from this budget. This is net of The DairyNZ levy of $0.036/kgMS *This milk income is the farmers best estimate of their likely net milk sales. It may or may not be out of date based on new information from Dairy Companies. It does not necessarily reflect DairyNZs milk price forecast.
1,522,900 7.85 2,986 6,621
Net Dairy Livestock Sales
Stock sales are made up of 90 MA cows/R2 heifers @ $660/head, 20 heifer calves @ $60/head, 360 bobby calves @$45/head.
76,800 0.40 151 334
Other Dairy Cash Income
Employee rent received for 3 houses.
31,000 0.16 61 135
NET DAIRY CASH INCOME 1,630,700 8.40 3,197 7,090
EXPENSES $TOTAL $/KgMS $/COW $/HA
Wages (incl. ACC)
Covers 1 farm manager, 1 assistant manager, 1 farm assistant and 0.6 FTE for casual for calf rearing, and throughout the year, as required. Halter technology has changed work routines and resulted in much improved work efficiencies. At the peak of calving, the staff hours worked is now under 45 hours per week.
270,000 1.39 529 1,174
Animal health
Focus is on prevention with minimal veterinary intervention required. Includes blood tests and copper supplementation. SCC for 22-23 is 129,000. The policy is to teat seal the whole herd, and use a selective programme for dry cow therapy. High SCC cows get long acting antibiotic, mid-range SCC cows get short acting antibiotic and low SCC cows are just teat sealed.
45,000 0.23 88 196
Breeding and herd improvement
Includes anoestrus and synchronisation treatment for non-cycling cows and 3 weeks AB plus 2 days to cover returns from cows treated for anoestrus. The top 20% of the herd on genetic merit are mated with sexed semen, the lowest 20% are mated to AB short gestation, (SG), Hereford semen and the rest of the herd is mated with premier sires. AB will continue for a further 5-6 weeks using SG Hereford semen. The last 2 weeks of mating is with AB using short gestation bull semen. Total mating length is 11 weeks, but with the use of SG semen the actual calving period is about 9 1/2weeks. The aim is to be finished calving by September 20th. Herd tests are 4 times per year, (drought permitting), with once a day testing. Cost also includes herd recording and identification, (including freeze branding of heifers coming into the herd). The budget at this stage includes mating the heifers to AB. Halter technology will provide all information for heat detection this season so no tail painting will be required.
45,000 0.23 88 196
Farm dairy
Rubberware is changed once a year, standard detergents used. Does cover the use of 2 sheds during the year. Twice a day milking till mid-December and then once a day for the rest of the season. While the plan is to only use one shed at a time apart from during calving both sheds will be used during the year depending on proximity to where the herd is grazing. Therefore both sheds need to be fully commissioned and operational.
9,000 0.05 18 39
Electricity (farm dairy, water supply)
Use hot water washes daily. Both sheds have a heat recovery unit fitted to the chiller so hot water is cheaper.
30,000 0.15 59 130
Supplements made (incl. Contractors)
This includes $52,800 for stack silage made on farm. It is estimated that 60 ha will be made, (2 t DM/ha @ $440/t DM). If there is a surplus of pasture in summer this will be made as small bales of hay to use for calves and springers. All harvesting is done by external contractors. Supplements made costs also includes $25,000 for 7.4 ha of maize silage grown on farm, ($3,300-$3,400/ha), using strip tillage and direct drilling. Yields of 18 t DM/ha are expected.
77,200 0.40 151 336
Supplements purchased
100 t PKE, (wet weight), @ $450/t landed, already contracted. 10 t DM hay @ $760/t landed.
52,600 0.27 103 229
Calf rearing
100 replacement heifer calves reared plus 5 beef. Calves are reared on colostrum and whole milk along with meal. Budget includes 7.0 t calf meal @ $1400/ t plus $3,000 bedding and dehorning and equipment. 380 bobbies will also consume colostrum for 6 days.
12,800 0.07 25 56
Young and drystock grazing
All yearlings and weaners are grazed on farm.
0 0.00 0 0
Winter grazing
All cows and in-calf heifers are grazed on farm.
0 0.00 0 0
Fertiliser (incl. N)
Have done individual paddock testing in the past so this information is used to be more strategic with fertiliser applications. Information from Halter technology has been used to modify grazing patterns and a redistribution of fertility is already evident after 30 months. This has resulted in lower requirements for synthetic fertilisers and more targeted applications. Fertiliser is largely applied with own gear, which allows for more targeted applications. The budget allows for 20 t DAP @ $1,600/t, 22 t sustaiN @ $1,150/ t and 20 t muriate of potash @ $1,550/t plus 40 t lime, (for 30 ha of crop paddocks), @ $40/t plus $6,000 cartage. This will deliver 60 kg N, 174 P, and 44 Kg K. DAP is used in the spring and urea the rest of the year. Effluent is applied to 75 ha - this area gets less fertiliser. Crop fertiliser allocation and cartage and spreading costs are included.
95,900 0.49 188 417
Regrassing & cropping
The budget is for planting 20 ha of chicory and 9 ha of turnips plus the regrassing of these areas in the autumn and the 7.4 ha maize area. There is some allowance for patching and undersowing of other pasture as needed. The areas to be planted are fluid and will depend on weather, soil conditions and pasture growth rates at the time of planting.
66,900 0.34 131 291
Weed and pest
Californian thistles are still a problem in some paddocks. Treatment includes topping so that regrowth is all at the same flower bud stage before spraying with an appropriate weed spray. Other weeds that are an issue are white daisy and yellow bristle grass. Includes about $6,000 for planting preparation and maintenance of existing riparian plantings.
14,000 0.07 27 61
Vehicles & fuel
Includes $18,000 for fuel, (with discounts from FarmSource), and $22,000 for service and repairs for tractors and other farm vehicles. Have very few vehicles - tend to use contractors for bigger jobs.
40,000 0.21 78 174
R&M (land, buildings, plant, machinery)
Have a policy of doing big maintenance jobs in good payout years so here is no major R and M planned for this year. Includes $16,000 for dwellings and other buildings, $1,000 for fencing, $3,000 for water supply, $15,000 plant and machinery, $15,000 for tracks and yards.
50,000 0.26 98 217
Freight and general farm expenses
Includes $5,000 for dog expenses, protective clothing and sundry, plus $4700 for bio security levy, ($0.024/kgMS).
9,700 0.05 19 42
Administration
Do own budgets, GST and PAYE. Covers for accountancy, communication, computer, subscriptions and mail, legal and consent costs and fees and subscriptions. Includes monitoring subscription for milk temperature, fuel levels and water flow.
20,000 0.10 39 87
Insurance
Reviewed every couple of years to ensure it is still relevant.
17,000 0.09 33 74
ACC
Owner ACC only. Employer ACC is included in wages.
5,000 0.03 10 22
Rates
Includes Council rates and regional environmental rates. Farm has multiple titles so rates are a bit higher than similar sized properties.
26,000 0.13 51 113
Other expenses
This covers the 12 month lease for Halter hardware, (neck halters), and software support for the Halter technology; $16/cow/month on an average number of 490 cows and 100 yearlings for the year, less a discount for one payment upfront for the year. This is the first year for the heifers so the final cost may differ from budget.
104,000 0.54 204 452
TOTAL FARM WORKING EXPENSES 990,100 5.10 1,941 4,305
CASH OPERATING SURPLUS 640,600 3.30 1,256 2,785

Non-cash adjustments have been included below the cash analysis to enable fairer comparisons to be made between farms. These adjustments are not part of a cash budget but are important to fully understand the efficiency of the farm business.

$TOTAL $/KgMS $/COW $/HA
Value of change in dairy livestock
Expect to have similar number of animals on farm at the end of the season, but there will be more MA cows and fewer in calf heifers. Values used are 2022 IRD NAMV.
12,400 0.06 24 54
Labour adjustment
This covers 0.4 FTE of unpaid management input from the owners. The owners have stepped back more from hands on farming and are spending more time in a management role and pursuing off farm interests. This also allows more time to focus on learning about, and integrating the use of Halter into the farm business so maximum benefit can be gained from using this technology.
40,000 0.21 78 174
Feed inventory adjustment
With the good 2023 autumn, more supplement will be carried into the winter than usual so it is expected there will be 40.8 t DM less on hand at the end of the season than at the start of the season. This is valued at $440/t DM.
-18,000 -0.09 -35 -78
Depreciation
Depreciation is based on the 2021-22 actual values plus allowance 2 further years depreciation and for asset purchases and sales for 2022-23 and 2023-24.
70,000 0.36 137 304
DAIRY GROSS FARM REVENUE 1,643,100 8.47 3,222 7,144
DAIRY OPERATING EXPENSES 1,118,100 5.76 2,192 4,861
DAIRY OPERATING PROFIT 525,000 2.70 1,029 2,283

Previous season reviews

2020-21 Season review

Financial KPI's

2020-21 Numbers at a glance
Financial KPI's* Budget Actual
Milk Production (kgMS/ha) 931 936
Milk Production (kgMS/cow) 339 349
Net Dairy Cash Income ($/kgMS) $6.54 $7.60
Total Farm Working Expenses ($/kgMS) $3.99 $4.25
Cash Operating Surplus/Deficit ($/kgMS) $2.05 $3.35
Gross Farm Revenue ($/kgMS) $6.49 $7.54
Operating Expenses ($/kgMS) $4.11 $4.42
Operating Profit ($/ha) $2,173 $2,916

*These KPI's are based on cashbook actuals to 31 May 2021 and estimated non-cash adjustments. The final financial performance based on financial statements may differ.

Click here for PDF of 2020-21 budget v actuals

Comments

  • The financial performance for the 2020-21 season was defined by better than expected production and milk price. Net cash dairy income was 19% up on budget while total farm working expenses were only up 9%.
  • The operating profit per ha for the season is estimated to be $2,916, which is 34% up on budget. A major contributing factor to this result is an increase in pasture eaten for the year of 1.3 t DM/ha. This is up 11.7% compared with the 2019-20 season.
  • The majority of the increase in farm working expenses was due to a 90% increase in repairs and maintenance. With the better than expected payout more discretionary work was carried out, equating to $0.24/kg MS, with projects including a major upgrade of the vet race and yards at one shed, double glazing 2 houses, and clearing willow trees.
  • In November 2020 the farm signed up to be part of the Halter programme. This farm management tool uses solar-powered, GPS-enabled smart collars fitted to each dairy cow and combines with a simple app to allow farmers to remotely shift, virtually fence and proactively monitor their cow’s health, feed and behaviour.
  • This system provides a greater level of information for less physical input than less technical options. To gain the full benefits from this programme effort is still required to interpret and act on the information provided.
  • Setting the farm up to fully integrate with this programme has taken a lot of the management focus for the latter part of the season. There will be ongoing changes to infrastructure as fences are removed so paddock sizes change from 1.8 ha to 4 ha to optimise land use.
  • Benefits are already being seen with cows moving a lot more quietly, particularly entering the farm dairy, and the farm owners and staff are looking forward to the first full year with this programme, particularly the additional information that it provides for monitoring cows during calving and mating.

Other points of interest

  • The early part of the season was great favourable weather conditions through winter and calving and with a better calving pattern getting the season off to a good start.
  • Early gains were eroded later in the spring as it seemed impossible to maintain pasture quality due to early seed head emergence and very high November pasture growth rates. This impacted pasture resulting in feed with lower digestibility and DM%. The situation was further exacerbated with delays in getting supplement off due to contractor unavailability. Production was 7% behind budget by the end of December.
  • Rainfall in the latter half of the season was much more regular than the previous season, and pasture growth rates were well up on the 2019-20 season. This made up for the earlier losses in the spring and the season finished with 5000 kg MS more than budgeted.
  • Both herds went to once-a-day milking on the 18th of December. 70 Culls went off the farm through February and March and the remaining 539 cows were milked through to May. The last of the herd was dried off in mid-May, which is the latest dry-off date for the farm for some years.
  • By May 31st pasture cover was at 2,350 kg DM per ha. 50% of the herd were at body CS of 5 and 50% were at 4.8, so well on track to meet the targets for planned start of calving.
  • Silage made on the milking area in the spring was at 69 ha or 30% of the farm was nearly double the area made in 2019-20. This was a result of better spring growth rates, but also due to having less area out for growing maize. Maize grown was only 3.7 ha instead of the budgeted 8 ha. Increased silage-making costs were offset by decreased maize growing costs.
  • Purchased feed costs were down as no hay was purchased. The good winter and spring meant very little of the hay on hand was fed out so there was still sufficient inventory on hand going into the 2021 winter. Maize purchased was 110 t DM (20 t DM up on budget), however, the price was less than budgeted, ($300 per t DM compared with $390 per t DM) so total costs was similar.
  • The not-in-calf rate was 16% which was disappointing as it is higher than the 2019-20 season of 11%. The six-week in-calf rate is 70% E which is below target and the lowest for the farm for the last 3 seasons. Some of this poorer performance could be attributed to the poorer pasture quality through November. This will be an area of focus for the 2021-22 season.
  • Sexed semen was used on the top 20% genetic merit cows for the first time this season. More of the lower genetic merit cows were mated to beef breeds. The aim of this strategy is to ultimately reduce the number of calves bobbied.
  • Incidences of downer cows as a result of low phosphorous meant the decision was made to use DAP despite soil tests indicating soil phosphate levels were more than adequate.

2019-20 Season review

Financial KPI's

Financial KPI's* Budget Actual
Milk Production (kgMS/ha) 936 817
Milk Production (kgMS/cow) 349 309
Net Dairy Cash Income ($/kgMS) $6.93 $7.56
Total Farm Working Expenses ($/kgMS) $3.87 $4.56
Cash Operating Surplus/Deficit ($/kgMS) $3.07 $3.01
Gross Farm Revenue ($/kgMS) $7.02 $7.46
Operating Expenses ($/kgMS) $4.05 $4.78
Operating Profit ($/ha) $2,782 $2,193

*These KPI's are based on cashbook actuals to 31 May 2020 and estimated non-cash adjustments. The final financial performance based on financial statements may differ.

Click here for PDF of 2019-20 budget v actuals

Comments

  • The financial performance for the 19-20 season was dominated by the effects of the Waikato wide low rainfall from October to April. Production was 12.8% down on budget, net cash dairy income was down 5% and total farm working expenses were up 3%.
  • The milk price received was 8% up on budget, ($0.54 per kg MS), and livestock sales were also up by the 8% which helped to slightly offset the impact of the lower milk production.
  • Repairs and maintenance are 28% up on budget as a considerable amount of time and money has been spent on development and improvement projects including
    • fencing of 5 ha retired for riparian planting
    • upgrading the water supply on the 65 ha added 2 years ago
    • implementing recommendations from the farm environment plan
    • extra work on tracks

Other points of interest

  • A mild winter and spring resulted in above average winter and spring growth rates. However, a less than ideal calving spread for 2019, below average pasture growth for October and lower stocking rate meant that production to the end of December was behind budget.
  • Limited freezing works space due to the drought meant that not all culls could go early February as planned, so about 60 cows were on farm for another 4-5 weeks putting further pressure on feed demand.
  • 85 t DM of early maize silage was imported to fill the gap until the farm grown crop was ready. This replaced 45 t PKE that had been in the budget.
  • The last of the herd was dried off mid-March as budgets for buying in PKE and milking longer showed a very small profit margin at current milk prices.
  • By May 31st pasture cover was at 2,450 kg DM per ha, and cow condition was 4.8 for the MA cows and 5.3 for the heifers, which is on track to meet the targets for planned start of calving.

Feed situation May 2020

Feed situation

Dry off date: 50% on 13/3/2020 and 50% 16/3/2020.

Culls still on farm: 9 empty heifers and 2 cows (slips) – will go before late May if possible.

% Milking area regrassed: 12% of farm (67% in annuals and 33% permanent pasture) due for first graze soon. Sown mid to late April which is 2-4 weeks later than usual due to lack of moisture.

N applied this autumn to date: 50% of the farm @ 30kg N per ha, with autumn fertiliser. Application started late April (about 10 days late) as access to contractors was held up.

Planned N application to end of month: 25% of the farm @ 30 kg N per ha.

Current situation Target for 31/5/2020 Target for PSC
Stocking Rate 2.79 2.74 2.74
Body Condition Score 4.75 MA cows 5.2 Heifers 4.8 MA cows 5.3 Heifers 4.9 (none less than 4.7) MA cows 5.5 Heifers
APC kg DM/ha 2100 2450 2300
Growth rates kg DM/ha/day 38 36 is minimum to get to target Average is usually 18-20
Supplements on hand 50 kg DM per cow wintered 21 kg DM per cow wintered 15 kg DM per cow wintered

Actions taken to address the feed shortage

  • Once a day for whole herd pre-Christmas.
  • Pregnancy tested early with the aim of being able to send all culls early February. Works space was limited and only got 33% away. This meant we had 60 culls on hand for 4-5 weeks longer than usual. Last lot went 18th March.
  • Went into summer with extra supplement (some made on farm and we purchased some late December). Started feeding this supplement from mid-January.
  • Also purchased 4 ha’s of early maize silage, (35 c per kg DM landed), when it was evident more cows would be carried into the summer for longer. This was fed through February and into March until our own maize was harvested. Maize yield was 16 t DM/ha – harvesting was about 2 weeks early due to extreme dry and heat. Maize was already at 41% DM when harvested. Having to harvest early reduced yield by about 2 t DM/ha.
  • The decision to dry the herd off mid-March was made after doing budgets for buying in PKE and milking longer. At the spot PKE price the profit margin was very small even with the current milk price. As there were plenty of other jobs to keep all staff fully employed it was decided to dry off!
  • Split the herd to allow preferential feeding for lighter condition cows.

Plans to achieve target APC and BCS and PSC targets

  • Continue to run 3 mobs of cows - 35% MA cows are in a light mob getting 4 kg DM maize and 6 kg DM grass, 65% MA cows are being fed 2 kg DM maize and 6 kg DM grass and R 2 heifers are being fed 8 kg DM grass. This allows stock to gain weight while keeping the rotation length at 150 days to maximise the gains from the current growth rates.
  • Continue with autumn fertiliser and N application.
  • Closely monitor growth rates, feed budget and BCS in order to adjust feeding rates quickly to keep both pasture cover and BCS as close to target a possible. Minimum growth rates of about 36 kg per ha per day are needed for the next 3 weeks to ensure target pasture cover is reached. This is achievable with the anticipated response to the N applications, plus the increase in the young grass growth, rates expected after the first grazing, particularly the annuals.

Concerns and plans for the upcoming weeks

  • The biggest threat for the next 3 weeks will be climatic. If it gets cold, (several heavy frosts), or stays dry over the next 2-3 weeks, growth rates will fall. 
  • If growth rates are below budget the cows would be fed less, (ie forgo some cow condition), so target pasture cover is not compromised.

2018-19 Season review

Financial KPIs

Financial KPI's* Budget Actual
Milk Production (kgMS/ha) 936 899
Milk Production (kgMS/cow) 338 323
Net Dairy Cash Income ($/kgMS) $6.35 $6.47
Total Farm Working Expenses ($/kgMS) $3.65 $3.76
Cash Operating Surplus/Deficit ($/kgMS) $2.69 $2.71
Gross Farm Revenue ($/kgMS) $6.45 $6.40
Operating Expenses ($/kgMS) $3.90 $4.02
Operating Profit ($/ha) $2,384 $2,144

*These KPI's are based on cash book actuals to 31 May 2019 and estimated non-cash adjustments. The final financial performance based on financial statements may differ.

Click here for PDF of 2018-19 budget v actuals

Comments

  • The overall financial performance for the business was very close to the budget which was a satisfactory result given that the 18-19 season was the first year of the larger farming operation, (60 more hectares and 165 more cows.
  • It is worth noting that the budget for the 18-19 season has a lower deferred milk income being the first year of the larger operation, ($350 per ha), and included some extra costs relating to the integration of the additional land.
  • Cash income was down 2%. The lower milk income was offset slightly by increased livestock income.
  • Total Farm working expenses were actually $9,929 under budget, (12%), which is $3.76 per kg MS on the lower than budgeted milksolids so F W E were 3.3% up on budget for the season.
  • Additional capital expenditure of $120,000 for an effluent system upgrade for one of the sheds was also able to be completed out of cash flow this year.
  • The labour costs for the farm have been well above average, (at around $1.40 per kg MS), for the last 2 seasons as the owners allowed for extra input to ensure successful implementation of the new business structure, (2017/18) and integration of the extra land, (2018/19). Labour requirements for the farm should reduce to more average levels from now on, (more like $1.00 per kg MS).

Other points of interest

  • The first part of the season was much improved on the previous 2 years in terms of rainfall and pasture growth. However September and October growth was still about 15% below average, and the latter part of November was wetter and colder.
    By late December feed on hand, pasture cover and soil moisture were all good and production was on target for 220,000 to 225,000 kg MS.
  • Hot windy weather and very little rain from mid-January to late April had a big impact on the final season’s performance, with production finishing at 211,250, (4.0% below budget).
  • All empty cows were culled after the early February pregnancy test, and drying off started early April with the last milking on April 11th.
  • A lot more re-grassing was carried out in the autumn to repair pasture damage from late winter and early spring 2018 and to remedy the opening up of pastures due to multiple and prolonged summer droughts. There is about 17% of the farm in new grass, under-sown with Italian shogun or in an annual grass/oats crop. It has all been direct drilled with no mechanical cultivation and has established well.
  • As at June 20th pasture cover is finally on target and cow condition is close to 5.0 so the farm is prepared for the start of calving.

2017-18 Season review

Financial KPI's

Financial KPI's* Budget Actual
Milk Production (kgMS/ha) 971 943
Milk Production (kgMS/cow) 347 340
Net Dairy Cash Income ($/kgMS) $5.45 $5.78
Total Farm Working Expenses ($/kgMS) $3.80 $3.66
Cash Operating Surplus/Deficit ($/kgMS) $1.65 $2.18
Gross Farm Revenue ($/kgMS) $5.21 $5.55
Operating Expenses ($/kgMS) $4.02 $3.78
Operating Profit ($/ha) $1,158 $1,669

*These KPI's are based on cash book actuals to 31 May 2018 and estimated non-cash adjustments. The final financial performance based on financial statements may differ.

Click here for PDF of 2017-18 budget v actuals

Comments

Spring was cold and relentlessly wet so got off to a slow start. Conditions improved from late September and because our farm drains well we had caught up lost production and were ahead by late November. Then the dry hit and production crashed precipitously! We put the cows onto once-a-day in early December and had no good quality feed to put them on so they didn't hold production levels as well as usual. Late summer things started to improve. We dropped only a proportion of our empties early as we had lots of feed all of a sudden. We had almost caught up with production again when we started feeding the maize. Unfortunately we had a new contractor this year and forgot to ask for a longer chop. It was fed out as we normally do but because it was a very fine chop and the grass was growing a lot more rapidly than normal - almost like spring pasture, a significant proportion of the herd developed ruminal acidosis to a greater or lesser extent. This dropped production precipitously again and it took a long time for the cows to pick up again this late in the season. We ended up with production 5,000 kg MS below budget but equal to last season which was not a particularly good season either!

The cows have picked up well since drying off and we are happy with their condition and have good pasture cover for next season. Have had a bit of an issue with lameness as the races have taken a hit with all the wet weather and cows have been stood off a bit as well.

Financially the year has gone reasonably well, with a slightly higher milk price offsetting the 3% lower than budget milk production.

Farm working expenses for the year finished at $3.66 per kg MS (including $1.15 per kg MS of owners PAYE wages).  This is 3.7% less than budgeted with the main variation being that 100 t DM of maize budgeted to be purchased in the autumn was not needed as some extra Maize was grown, 5 ha more grass silage was made and very little was needed to be fed in the autumn due to exceptional pasture growth rates.

Despite the lack of deferred income of about $1.20 due to the 17-18 season being the first year of operation under this equity partnership, the business generated enough cash surplus to be able to repay the early season working capital borrowings, plus put aside sufficient funds to tide us over the 2018 winter and early spring.

Other points of interest

The maize was again planted with minimum tillage – spray and direct drill which does impact yield.  It was slow establishing because of the dry conditions but despite that still gave 16-17 t DM per ha.

We are very happy with the minimum tillage approach as the soil structure is much improved and will continue with this method in the future.

N use was 85 kg N per ha which was similar to the previous season but up on budget, again largely due to the cold wet weather in the late spring period.

Somatic cell count for the season is 132400 which is up a little on the previous season but still reasonable given the cows were on once a day for so long and just how wet it was in the spring.

The first round of mating went well with good submission rates, however the very hot weather and poor quality pasture through late November and December resulted in above average numbers of late empty cows.

2016-17 Season review

Financial KPI's

Financial KPI's* Budget Actual Physical KPI's 2016/17
Net Dairy Cash Income ($/kgMS) $4.67 $6.29 Milk Production (kgMS/ha) 923
Total Farm Working Expenses ($/kgMS) $2.69 $2.95 Pasture and Crop Eaten (t DM/ha) 12.2
Cash Operating Surplus/Deficit ($/kgMS) $1.98 $3.34 Imported Supplements & Dry Cow Grazing (% of total feed eaten) 5%
Gross Farm Revenue ($/kgMS) $4.69 $6.33 Six Week In-Calf Rate (*A=Actual E=Estimated) 78% A*
Operating Expenses ($/kgMS) $3.35 $3.65 First Calvers on Farm End of Season(% of first calvers at start of season) 88%
Operating Profit ($/ha) $1,303 $2,517 Milksolids per Labour Unit (kgMS/FTE) 68,472

*These KPI's are based on cash book actuals to 31 May 2017 and estimated non-cash adjustments. The final financial performance based on financial statements may differ.

Click here for PDF of 2016-17 budget v actuals

Comments

The 16-17 season was one of two halves;

A cold wet August followed by a very dull, wet October with poorer pasture growth and quality due to less sunshine had an impact on production and costs for the first half of the season. Production was down 6,000 kg on budget by the end of December and more supplement had been purchased in early spring.

Better than average summer/autumn rainfall meant less supplement was needed and the decline in production was halted.

Below average pasture growth rates and very wet soil conditions in May 2017 has meant that the season has finished with cows in condition score 4.8 and pasture cover of 2,100 kg DM/ha, both of which are a little behind target.  Continued slow pasture growth for the early winter and dull wet conditions are impacting our target pasture cover at calving.

A deliberate decision to carry out additional R &M in response to the increase in milk price accounted for $0.10 /kg MS and unplanned repairs to farm vehicles accounted for another $0.07/kg MS.  This combined with production being down 3% on budget gave farm working expenses (FWE) for the year of $2.95 per kg MS ($0.26 /kg MS up on budget).

Keeping a close watch on the budget as the season unfolded meant that decisions could be made quickly as circumstances changed.

More budget case study farms

Want to see how the top operators are spending their money? Are there areas for improvement in your own business where savings can be made? We’ve collected in-depth current season budgets from a number of top performing farms with a focus on lower ‘per unit’ cost of production to help you identify opportunities.

Last updated: Aug 2023
Share:
Tags related to “Budgeting, Pete Morgan and Ann Bouma (South West Waikato)”